Construction KPIs (Key Performance Indicators) are the indicators that let you tell, with a handful of numbers, whether a project or a construction company is doing well. A good dashboard does not need fifty indicators: just enough to detect problems in time and make decisions.
In this article we compile the most commonly used KPIs, grouped by area, with their formulas and what each one is for.
How to choose your company's KPIs
A good KPI is:
- Relevant: tied to an objective (margin, schedule, safety).
- Measurable with reliable data that already exists or can be obtained without excessive effort.
- Actionable: if it gets worse, someone knows what to do.
- Periodic: always calculated with the same frequency and criteria.
Cost KPIs
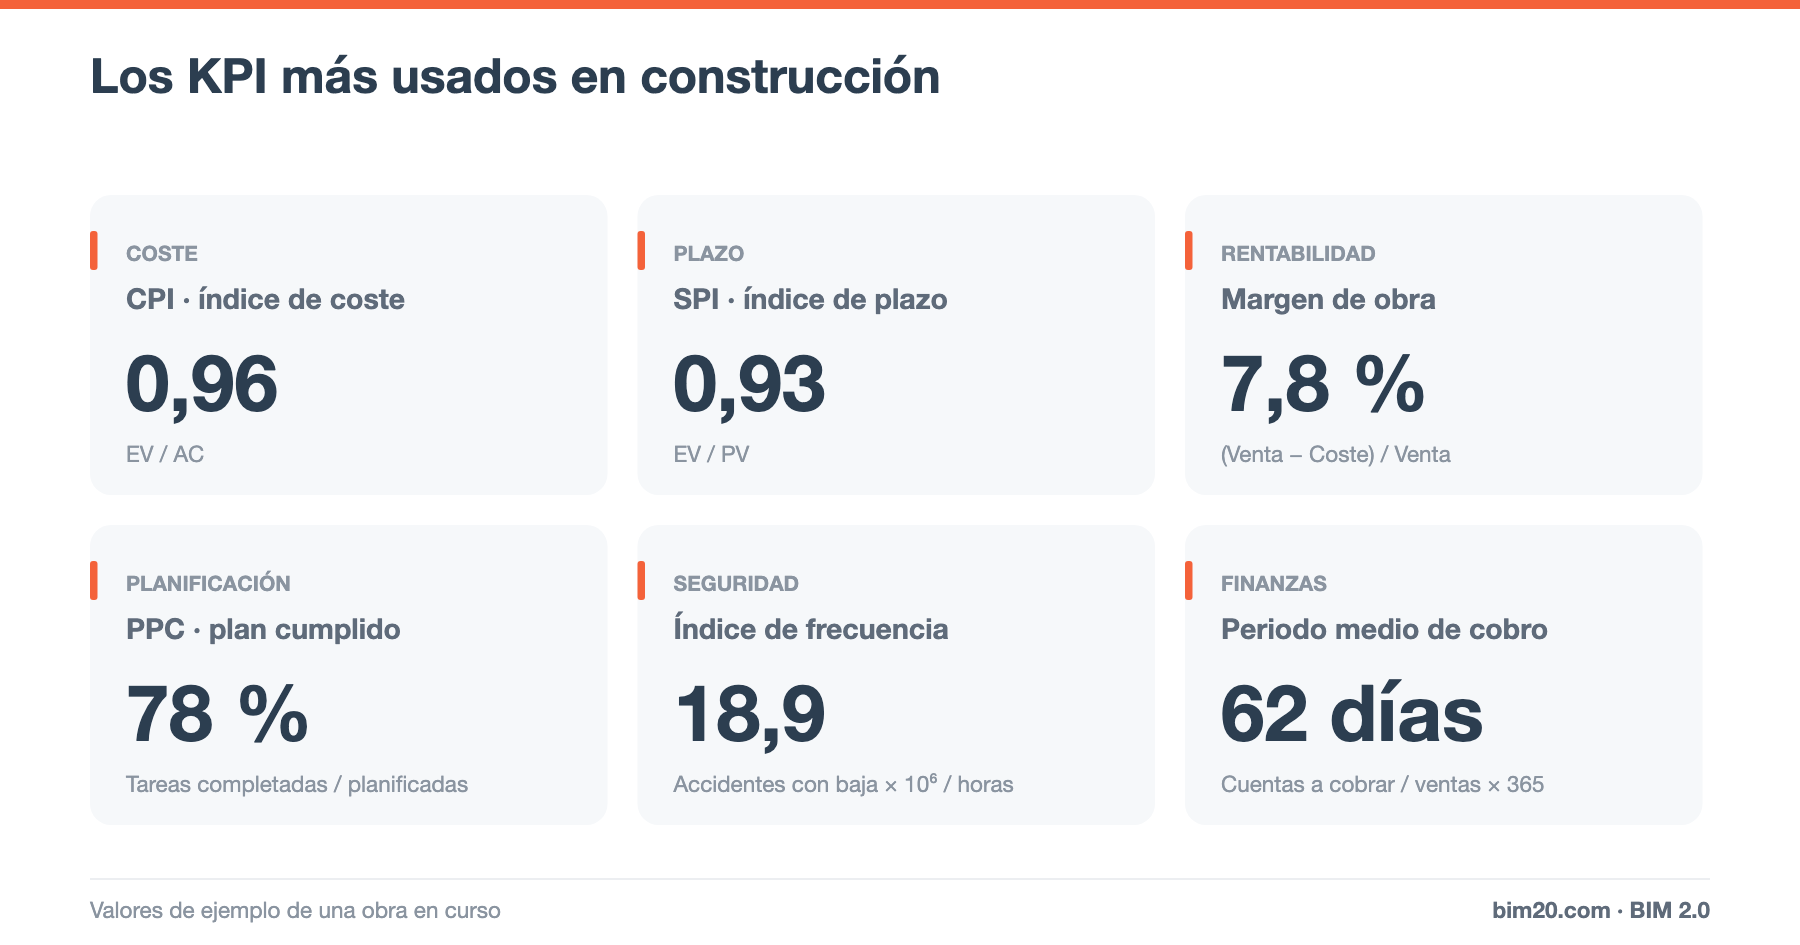
- CPI (Cost Performance Index) = EV / AC. Cost efficiency of the work performed. See CPI and SPI.
- Budget variance (%) = (actual cost − planned cost for the work performed) / planned cost. See variance analysis.
- EAC and VAC: forecast final cost and variance at completion. See EAC, ETC, VAC and TCPI.
- Cost per built m². To compare projects and feed future estimates.
- Weight of indirect costs relative to direct cost. See direct and indirect costs.
Schedule and planning KPIs
- SPI (Schedule Performance Index) = EV / PV.
- Actual vs planned progress (%), shown with the S-curve.
- Days of delay on the critical path. See critical path method.
- Milestones met on time (%) = milestones met / milestones planned to date.
- PPC (Percent Plan Complete) = tasks completed / tasks committed in the week. It comes from the Last Planner system and measures the reliability of short-term planning. As a common reference, values above 80% are considered good.
Profitability KPIs
- Gross project margin (%) = (revenue − project cost) / revenue. See how to calculate project margin.
- Planned vs actual margin.
- Monthly output (certified + work performed not yet certified).
- Backlog: output yet to be executed on signed contracts.
- Break-even point of the company. See break-even point for a construction company.
Financial KPIs
- Days sales outstanding (days) = average receivables / sales × 365.
- Days payable outstanding (days) = average payables / purchases × 365.
- Work performed not yet certified. See unbilled work.
- Peak financing requirement of the project. See project cash flow.
- NPV and IRR for investment decisions. See NPV, IRR and ROI.
Productivity KPIs
- Actual vs planned productivity rate (h/unit) per line item. See labor productivity rate.
- Output per hour worked (€/h).
- Productive equipment hours / total hours.
Quality KPIs
- Open non-conformities and average closing time.
- Cost of rework and repairs relative to total cost.
- After-sales incidents per dwelling or per million euros of output.
- Customer satisfaction (surveys).
Health and safety KPIs
- Frequency rate = lost-time accidents × 10⁶ / hours worked.
- Severity rate = days lost × 10³ / hours worked.
- Incidence rate = lost-time accidents × 10⁵ / average number of workers.
We explain them with an example in accident rate indicators in construction.
Commercial KPIs
- Tender win rate = bids awarded / bids submitted.
- Average discount on awarded bids.
- Average bid preparation time.
How to build a project dashboard
- Choose between 6 and 10 KPIs per level (project, production management, executive management).
- Define the formula, data source, frequency and owner of each one.
- Set alert thresholds (a traffic light with a numerical value, never just the color).
- Automate data collection: if the KPI depends on an Excel file someone fills in by hand, it will end up outdated.
- Review the KPIs at the monthly closing meeting and assign actions.
Frequently asked questions
What are the 5 essential KPIs on a project?
Actual vs planned margin, CPI, SPI, work performed not yet certified, and accident frequency rate.
How often should they be reviewed?
Cost and schedule KPIs monthly; PPC and safety weekly.
Conclusion
Construction KPIs are only useful if they are based on reliable data and reviewed with discipline. Start with a few well-defined indicators and automate their calculation.
👉 BIM 2.0 for Odoo brings together the estimate, actual costs, certifications, earned value and technical-economic indices (ITE) in a single system. Request a demo.