Safety is the first KPI of any project. To measure it objectively and comparably, accident rate indicators are used: the frequency rate, the severity rate, the incidence rate and the average duration of sick leave.
These indicators let you compare projects of different sizes, track the company's progress over the years and benchmark against industry statistics.
Data needed
- Lost-time accidents (occurring during working hours; commuting accidents, known in Spain as in itinere, are normally excluded).
- Workdays lost because of those accidents.
- Hours worked by exposed personnel in the period.
- Average number of exposed workers.
Frequency rate (FR)
Number of lost-time accidents per million hours worked:
FR = (lost-time accidents / hours worked) × 1,000,000
It measures how many accidents occur relative to risk exposure. It is the most widely used indicator for comparing projects and companies.
Severity rate (SR)
Workdays lost per thousand hours worked:
SR = (workdays lost / hours worked) × 1,000
It measures the severity of accidents: two companies with the same FR can have very different SRs.
Incidence rate (IR)
Lost-time accidents per hundred thousand workers exposed:
IR = (lost-time accidents / average number of workers) × 100,000
This is the index official statistics usually use to compare sectors, because it does not require knowing hours worked.
Average duration of sick leave (ADL)
ADL = workdays lost / lost-time accidents
Example
A contractor records the following in one year:
- 12 lost-time accidents.
- 310 workdays lost.
- 480,000 hours worked.
- 300 workers on average.
Calculation:
- FR = 12 / 480,000 × 1,000,000 = 25.0
- SR = 310 / 480,000 × 1,000 = 0.65
- IR = 12 / 300 × 100,000 = 4,000
- ADL = 310 / 12 = 25.8 days
Tracking the trend
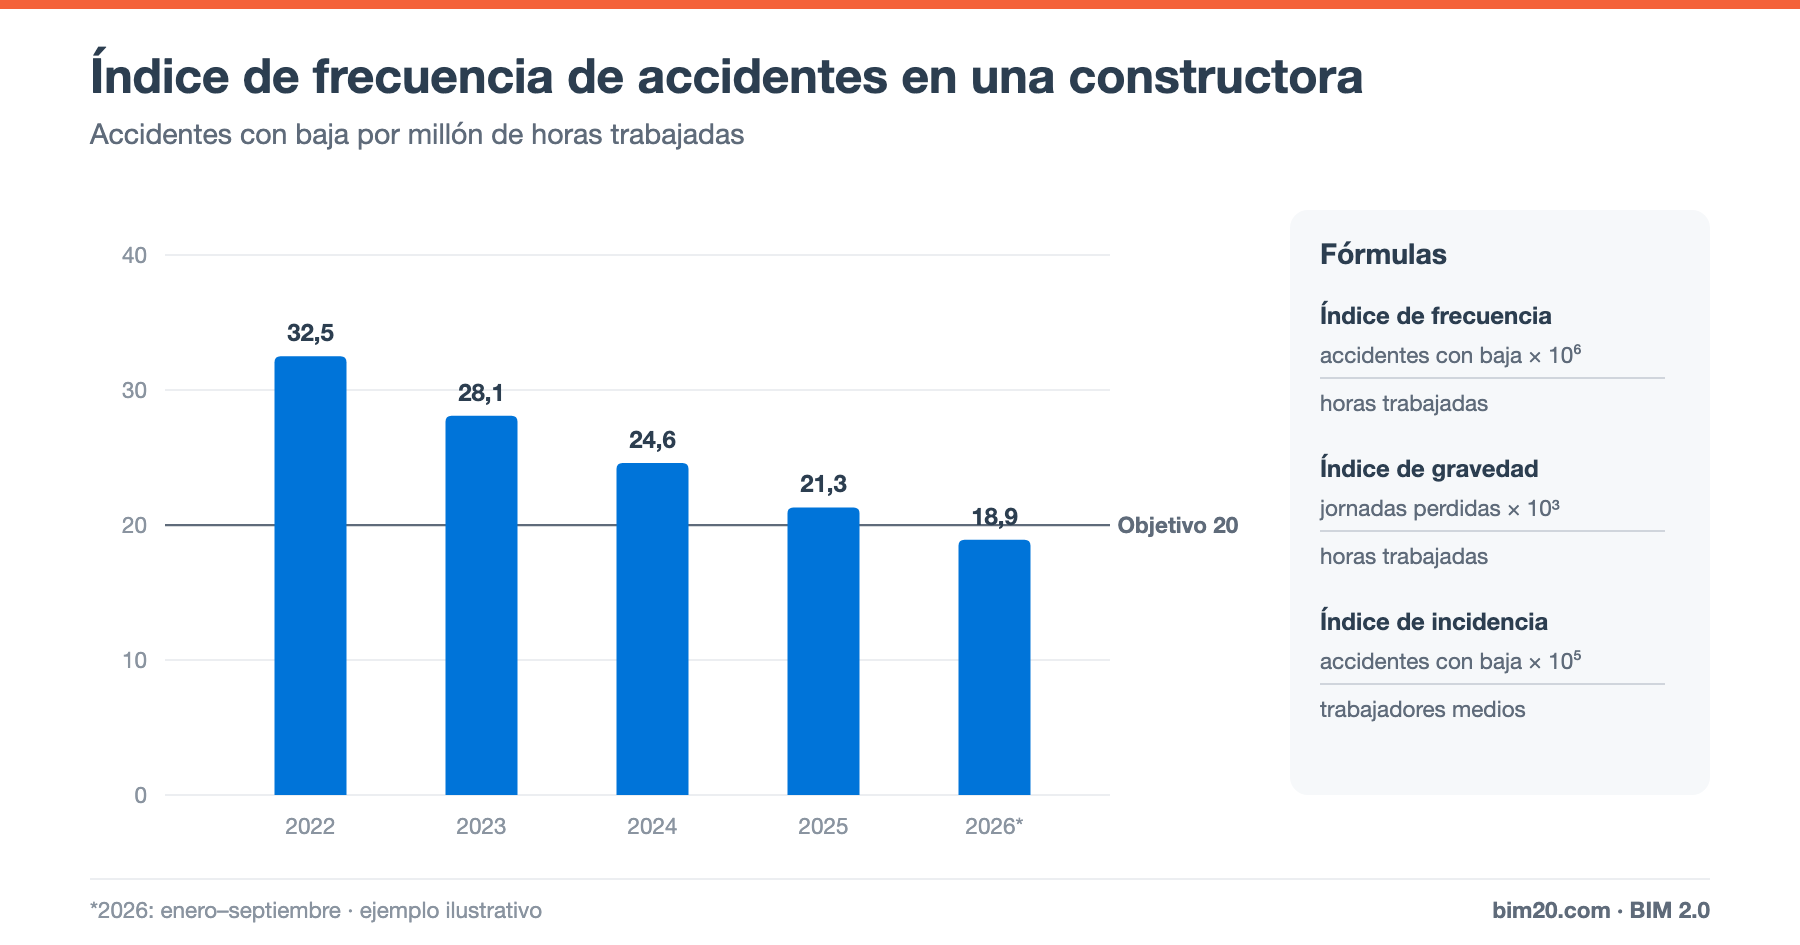
In the article's chart, a contractor's frequency rate has fallen from 32.5 in 2022 to 18.9 in 2026 (data from January to September), below the internal target of 20. For a fair comparison between years, always compare equivalent periods or annualize the figure.
How to use the indicators in management
- Set targets by company and by project (for example, FR < 20).
- Compare projects: a project with an FR well above average needs a review of its safety plan.
- Include subcontractors: in construction, a significant share of the hours are worked by subcontractors; if you only measure your own hours, the picture is incomplete. See subcontractor management.
- Review trends, not just one month's value: with few accidents, monthly indicators fluctuate widely.
Preventive (proactive) indicators
Accident rate indicators are reactive: they measure what has already happened. They should be complemented with proactive indicators:
- Safety inspections carried out vs planned.
- Preventive observations and unsafe conditions corrected.
- Hours of safety training per worker.
- Incidents without lost time and near misses reported.
- Compliance with the measures in the health and safety plan.
An increase in reported near misses is usually a good sign: it indicates a reporting culture.
Accidents and cost
Accidents have a direct cost (replacements, penalties, surcharges) and a significant indirect cost: stoppages, delays, lost productivity and reputational damage. That is why safety is also among the most widely used KPIs in construction and affects project productivity.
Frequently asked questions
What is a good frequency rate in construction?
It depends on the type of project and the country. The most useful approach is to compare against official industry statistics and, above all, against your own progress over time.
Are subcontractors' accidents counted?
For managing site safety, yes. For company statistics, each company counts its own workers; it is advisable to keep both sets of data.
Conclusion
Frequency, severity and incidence rates turn safety into comparable data. Calculated rigorously, accompanied by preventive indicators and reviewed with the same discipline as costs, they help reduce accidents on site.
👉 BIM 2.0 for Odoo lets you record attendance, checklists and project tickets, which are the basis for these indicators. Request a demo.