The productivity rate (in Spanish, rendimiento) is the amount of a resource needed to execute one unit of work. It is the concept that links the estimate to reality: if the planned rate is not met, the line item's cost and the project schedule drift.
In this article we explain what the rate is, how it is calculated for each type of resource, how to measure it on site and how to interpret its variances.
What is a productivity rate
In the unit price analysis, each line item is broken down into resources. The rate is the coefficient that tells you how much of each resource is needed per unit:
- Labor: hours per unit (h/m², h/m³, h/each).
- Equipment: machine hours per unit.
- Materials: quantity of material per unit, including waste (for example, 1.05 m³ of concrete per m³ placed).
Example: for a half-brick-thick masonry wall, a rate of 0.45 h/m² for a skilled mason and 0.225 h/m² for a laborer means the crew needs 0.675 hours of work for each square meter.
Rate and productivity
They are often confused, but they are inverses:
- Rate = hours / unit (the lower, the better).
- Productivity = units / hour (the higher, the better).
0.675 h/m² is equivalent to a productivity of 1.48 m²/h. We go deeper into productivity in how to measure productivity on site.
How to calculate the actual rate on site
Actual rate = actual hours charged to the line item / quantity executed
To calculate it you need two reliable data points:
- Hours per line item, from timesheets.
- Quantity executed, from progress measurements.
Example
450 m² of brick masonry have been built and the timesheets record 333 hours of masons and laborers on that line item.
- Actual rate = 333 / 450 = 0.74 h/m²
- Planned rate = 0.675 h/m²
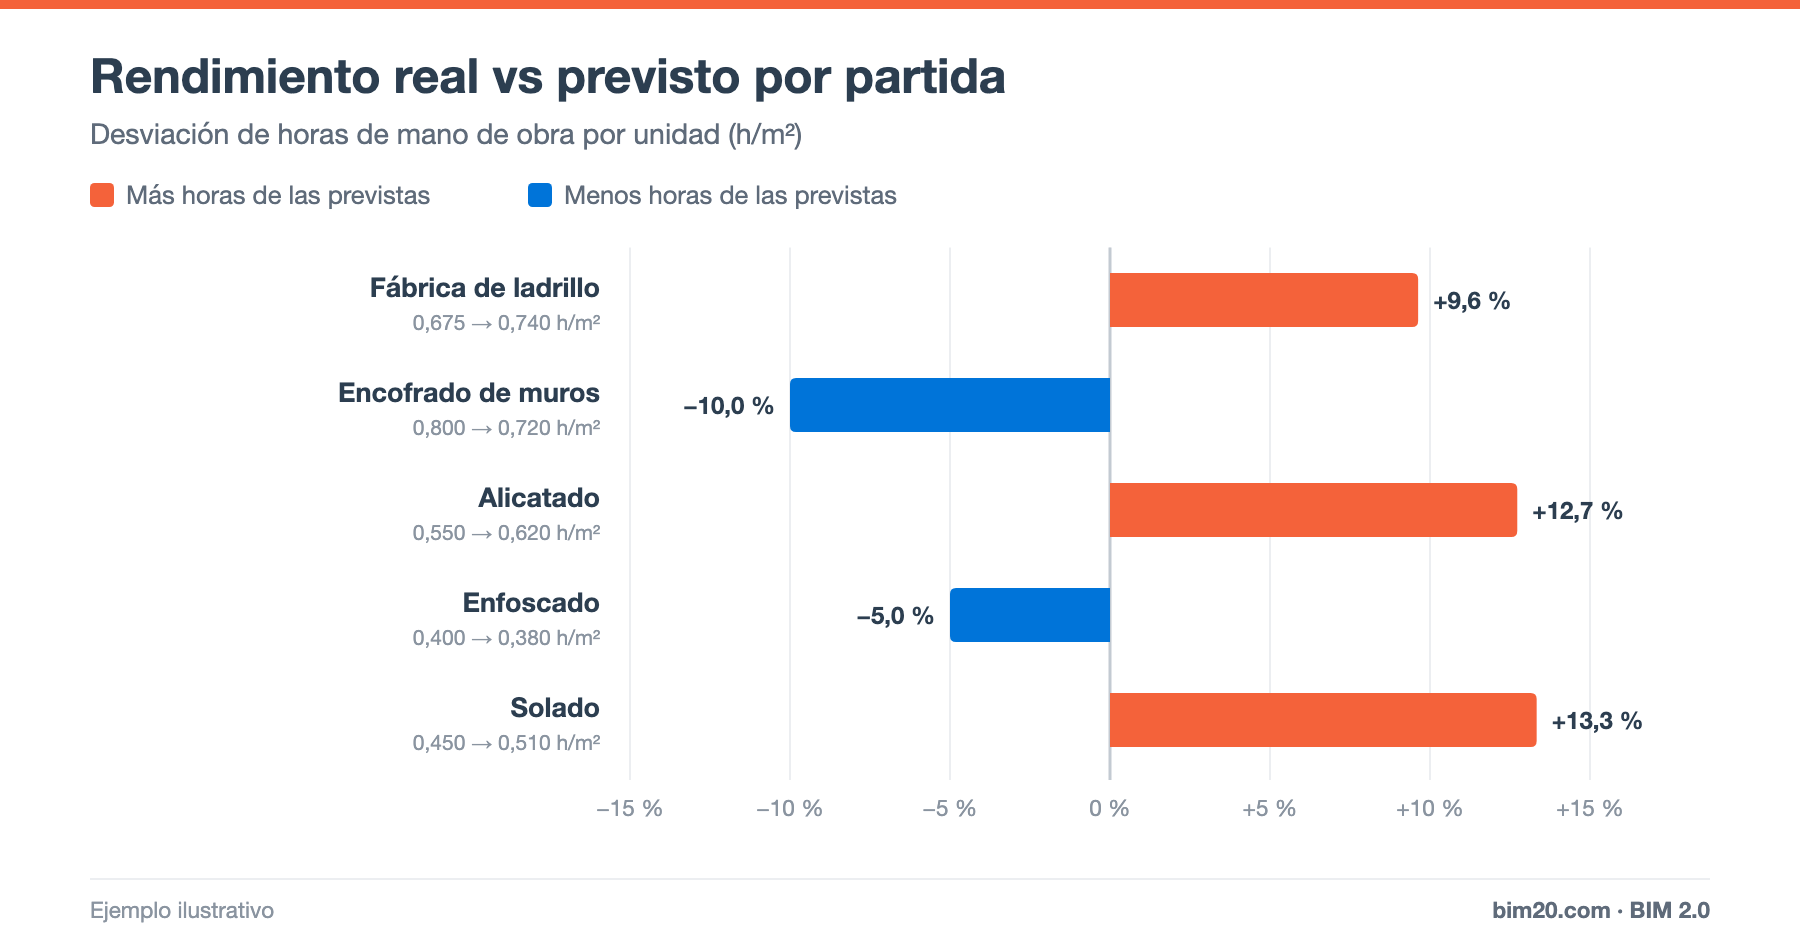
- Variance = 0.74 / 0.675 − 1 = +9.6%
That is 29.25 more hours than planned (333 − 450 × 0.675 = 29.25). At an assumed average cost of €20/h, that is €585 of overrun on this line item, and the trend will repeat across the rest of the masonry if it is not corrected.
Analyzing variances by line item
Comparing actual and planned rates line item by line item shows where you gain and where you lose. In the example illustrated in the article's image:
- Brick masonry (+9.6%), tiling (+12.7%) and flooring (+13.3%) use more hours than planned.
- Wall formwork (−10%) and plastering (−5%) perform better than planned.
Positive variances in hours are usually due to:
- Estimate rates taken from price databases without adjustment.
- Poor work-front organization: waiting for materials, interference with other trades.
- Incomplete or unbalanced crews (too many skilled workers or too many laborers).
- Rework caused by poor quality.
- Unforeseen conditions: heights, access, weather.
Factors that affect the rate
- Repetition: typical floors improve along the learning curve.
- Size of the work front: small, discontinuous work fronts are less productive.
- Auxiliary means: scaffolding, material hoisting, crane availability.
- Short-term planning: work fronts prepared and materials in place.
- Experience and training of the crew.
- Weather and safety conditions.
Equipment productivity
It is calculated the same way: machine hours / quantity produced. For equipment it is key to separate productive hours from hours idle on site: a rented machine that sits idle still costs money. See how to calculate its hourly cost in materials, labor and equipment.
Material consumption rates
For materials, actual consumption is compared with planned consumption. If 380 m³ of concrete were purchased and consumed for 350 m³ executed, actual consumption is 1.086 m³/m³ (380 / 350) versus 1.05 planned. We explain it in price and consumption variance analysis.
How to improve productivity rates
- Measure: without timesheets by line item there is no actual rate.
- Review weekly the largest line items.
- Feed back into the estimate: update your price database with the actual rates from completed projects.
- Prepare the work fronts: materials, equipment and areas ready before the crew arrives.
- Plan with subcontractors and measure weekly compliance (PPC, percent plan complete).
Frequently asked questions
Where do I get rates for estimating?
From price databases as a starting point and, above all, from your own projects. Your company's historical rates are the most valuable asset for accurate estimating.
Is a worse rate always a crew problem?
No. It is often due to organization: waiting time, lack of materials or interference.
Conclusion
The rate is the bridge between what is estimated and what happens on site. Measuring it line item by line item, comparing it with the plan and carrying that experience into future estimates is one of the most effective ways to improve margin.
👉 In BIM 2.0 for Odoo, attendance and timesheets are charged to each project and line item, so you can compare actual and planned hours. Request a demo.