Construction productivity measures how much is produced per unit of resource used. It is one of the sector's big challenges: construction is often pointed to as an industry with room to improve its productivity, and a large part of a project's margin depends on how well working hours are used.
In this article we explain how to measure productivity, what the learning curve is and which factors affect it.
What is productivity in construction
In general terms:
Productivity = output / resources used
It can be measured in several ways:
- Physical: units executed per hour (m²/h, m³/h, units/shift).
- Economic: output in euros per hour worked or per worker.
- Company-wide: annual output per employee.
Physical productivity is the inverse of the labor productivity rate: if the rate is 0.675 h/m², productivity is 1.48 m²/h.
The most useful productivity indicators
- Productivity per line item: units executed / hours charged. The most useful one for the site manager.
- Productivity index: planned rate / actual rate. Above 1 → work is going better than budgeted.
- Output per hour worked: € certified / total project hours.
- Percentage of productive time: direct work hours / total hours (the rest is waiting, travel, rework).
- PPC (Percent Plan Complete): tasks completed / tasks committed for the week. It measures the reliability of planning, which has a major impact on productivity. We cover it in the most widely used KPIs in construction.
The learning curve
When a task is repeated, the crew performs it faster and faster. This is what happens in buildings with typical floors, serial housing or repetitive sections of civil works.
The classic model (Wright's) states that each time the number of repetitions doubles, the time per unit falls to a fixed percentage, called the learning rate:
Tₙ = T₁ × n^b, with b = log₂(r)
Where T₁ is the time for the first unit, n is the repetition number and r is the learning rate.
Example
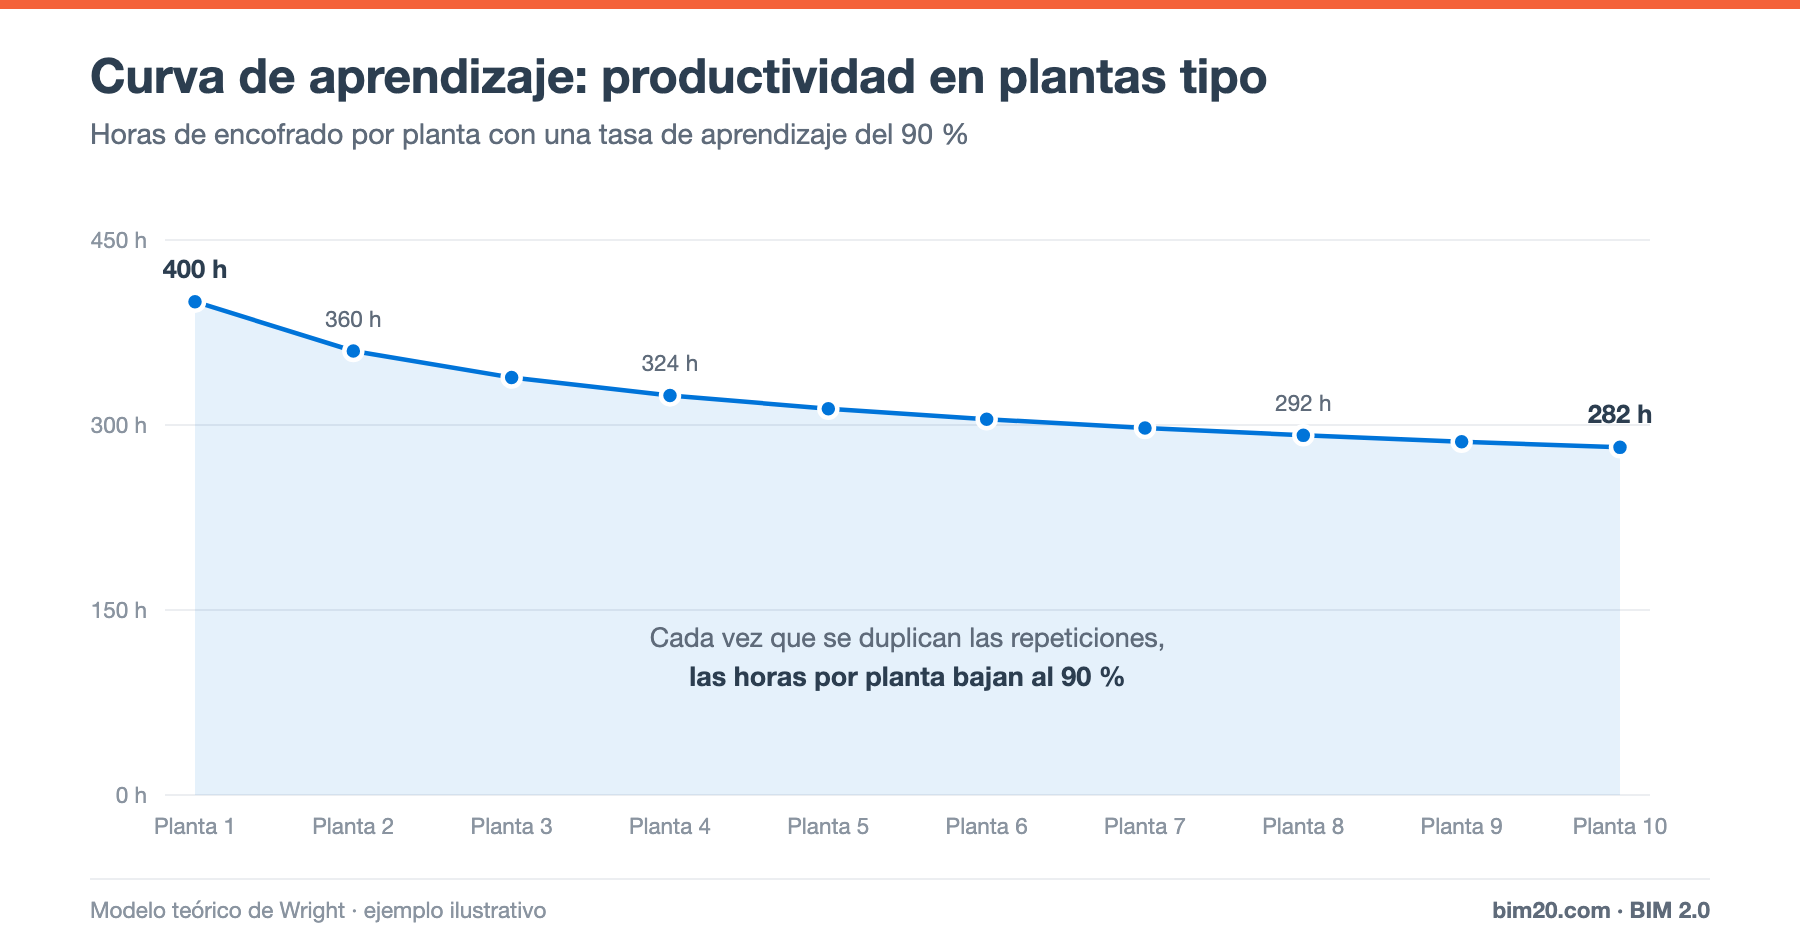
Formwork for a typical floor: the first floor takes 400 h and the learning rate is 90%.
- Floor 1: 400 h
- Floor 2: 360 h (400 × 0.90)
- Floor 4: 324 h (360 × 0.90)
- Floor 8: 292 h (324 × 0.90)
- Floor 10: 282 h
Calculating each floor with the formula (Tₙ = 400 × n^b, with b = log₂ 0.90 ≈ −0.152), the 10 floors add up to about 3,198 hours, compared with the 4,000 you would get by multiplying the first floor by ten: 20% less.
Practical implications
- Estimating: using the first floor's rate for all floors makes the bid more expensive; using the tenth floor's rate for all of them makes it too cheap. The right approach is the expected average rate.
- Scheduling: the first floors take longer; a schedule with equal durations for all of them will generate fictitious "delays" at the start.
- Crew stability: changing crew or subcontractor midway through the series wastes what has been learned.
- Interruptions: stopping the series (because of missing material or payments) causes "forgetting" and the curve goes backwards.
Factors that reduce productivity
- Waiting: for materials, crane, other trades, instructions.
- Rework due to errors or poor quality.
- Lack of short-term planning: work fronts not prepared.
- Design changes during execution.
- Congestion: too many crews in the same space.
- Prolonged overtime: fatigue reduces output per hour.
- Poor information: outdated or contradictory drawings.
How to measure productivity in practice
- Charge hours to line items, not just to the project.
- Measure the quantity executed of the main line items every week.
- Calculate units per hour and compare them with the estimate.
- Analyze time losses with field observations (work sampling).
- Share the results with foremen and subcontractors.
A construction ERP makes this measurement easier because timesheets, attendance and progress are recorded in the same system as the estimate.
How to improve productivity
- Collaborative weekly planning with subcontractors (Last Planner).
- Preparing work fronts in advance (material, equipment, areas).
- Industrialization and prefabrication where possible.
- BIM to coordinate disciplines and avoid clashes. See 5D BIM.
- Standardizing construction solutions to take advantage of the learning curve.
- Measure and feed back: what is not measured does not improve.
Frequently asked questions
What learning rate is typical in construction?
According to the literature, it usually falls in an approximate range of 80% to 95%, depending on the complexity and repetitiveness of the task. Ideally, calculate it with your own data.
Are productivity and labor rate the same thing?
They are inverses: the labor rate measures hours per unit and productivity measures units per hour.
Conclusion
Measuring productivity per line item, understanding the learning curve and tackling waiting time and rework are the most direct levers to improve a project's margin without touching prices.
👉 With BIM 2.0 for Odoo you can record attendance and timesheets per project and compare the hours with the estimate. Request a demo.