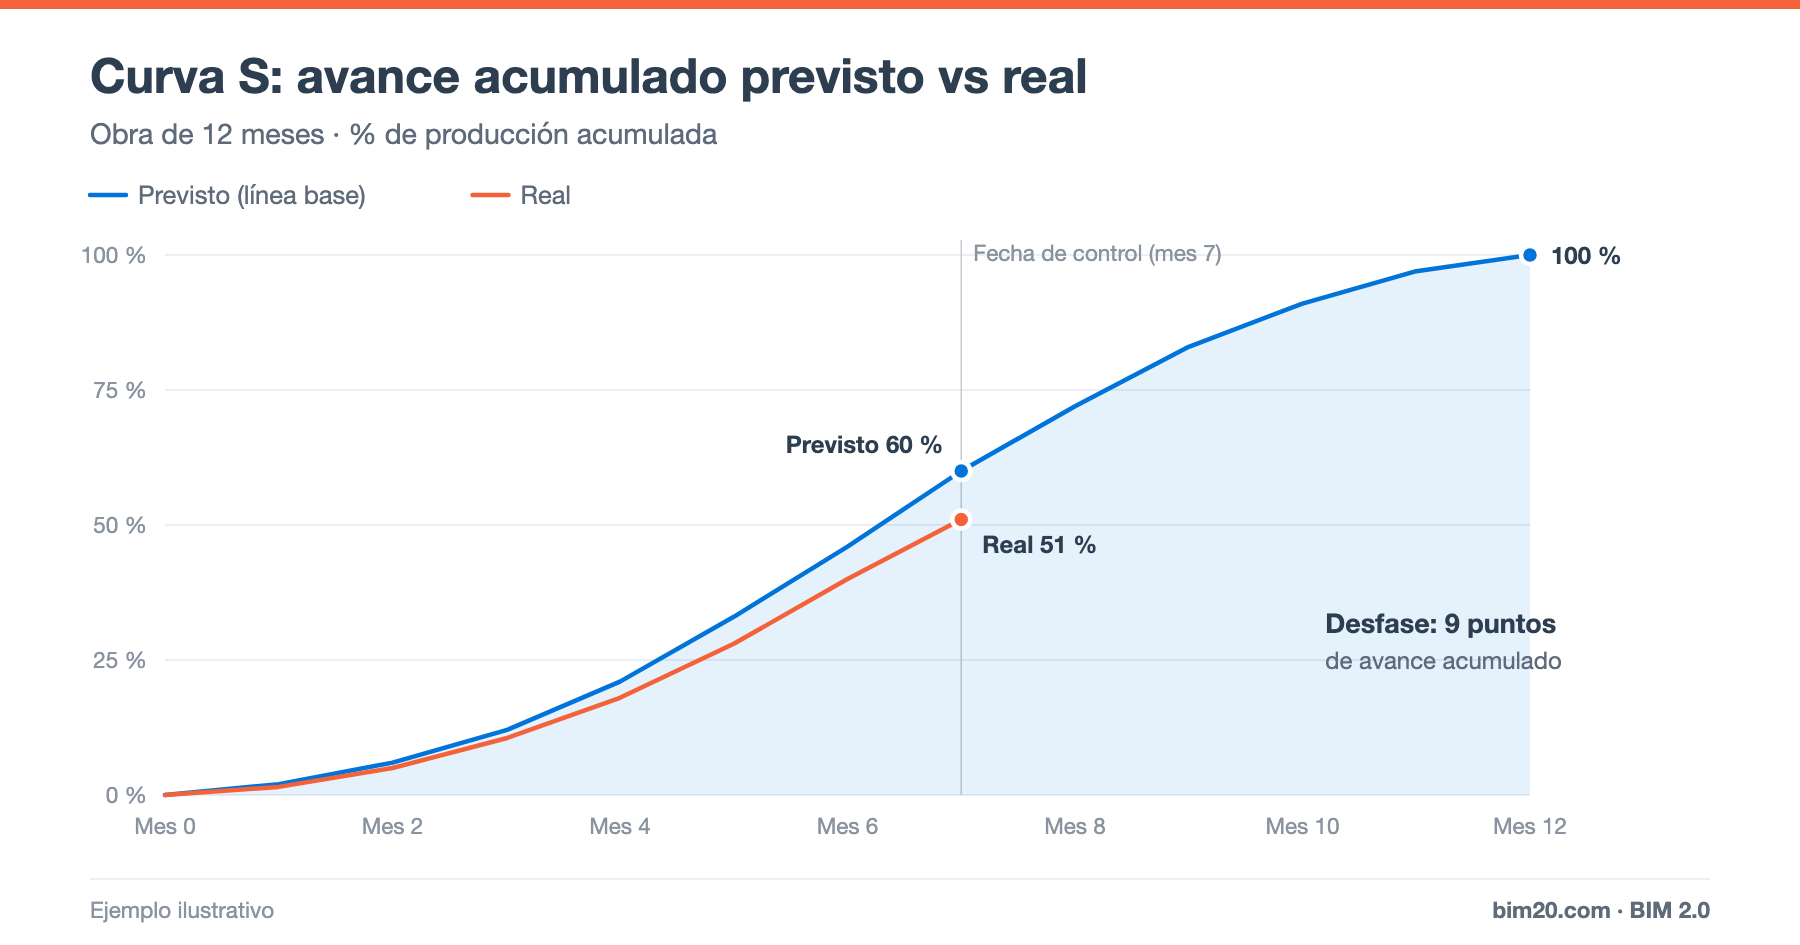
The S-curve is one of the most widely used charts in construction management. It shows the cumulative progress of a project (as a percentage or in euros) over time, and gets its name from the stretched "S" shape it draws: it starts slowly, speeds up in the middle of the project and slows down again at the end.
In this article we explain where that shape comes from, how to calculate it step by step and how to use it to control schedule, output and cash.
Why the curve is S-shaped
Output on a construction project is not uniform:
- At the start few activities are under way: site setup, setting out, earthworks. Monthly output is low.
- In the middle phase structure, envelope, services and partitions overlap. This is the period of peak output.
- At the end there is punch-list work, finishes, testing and cleanup: output falls again.
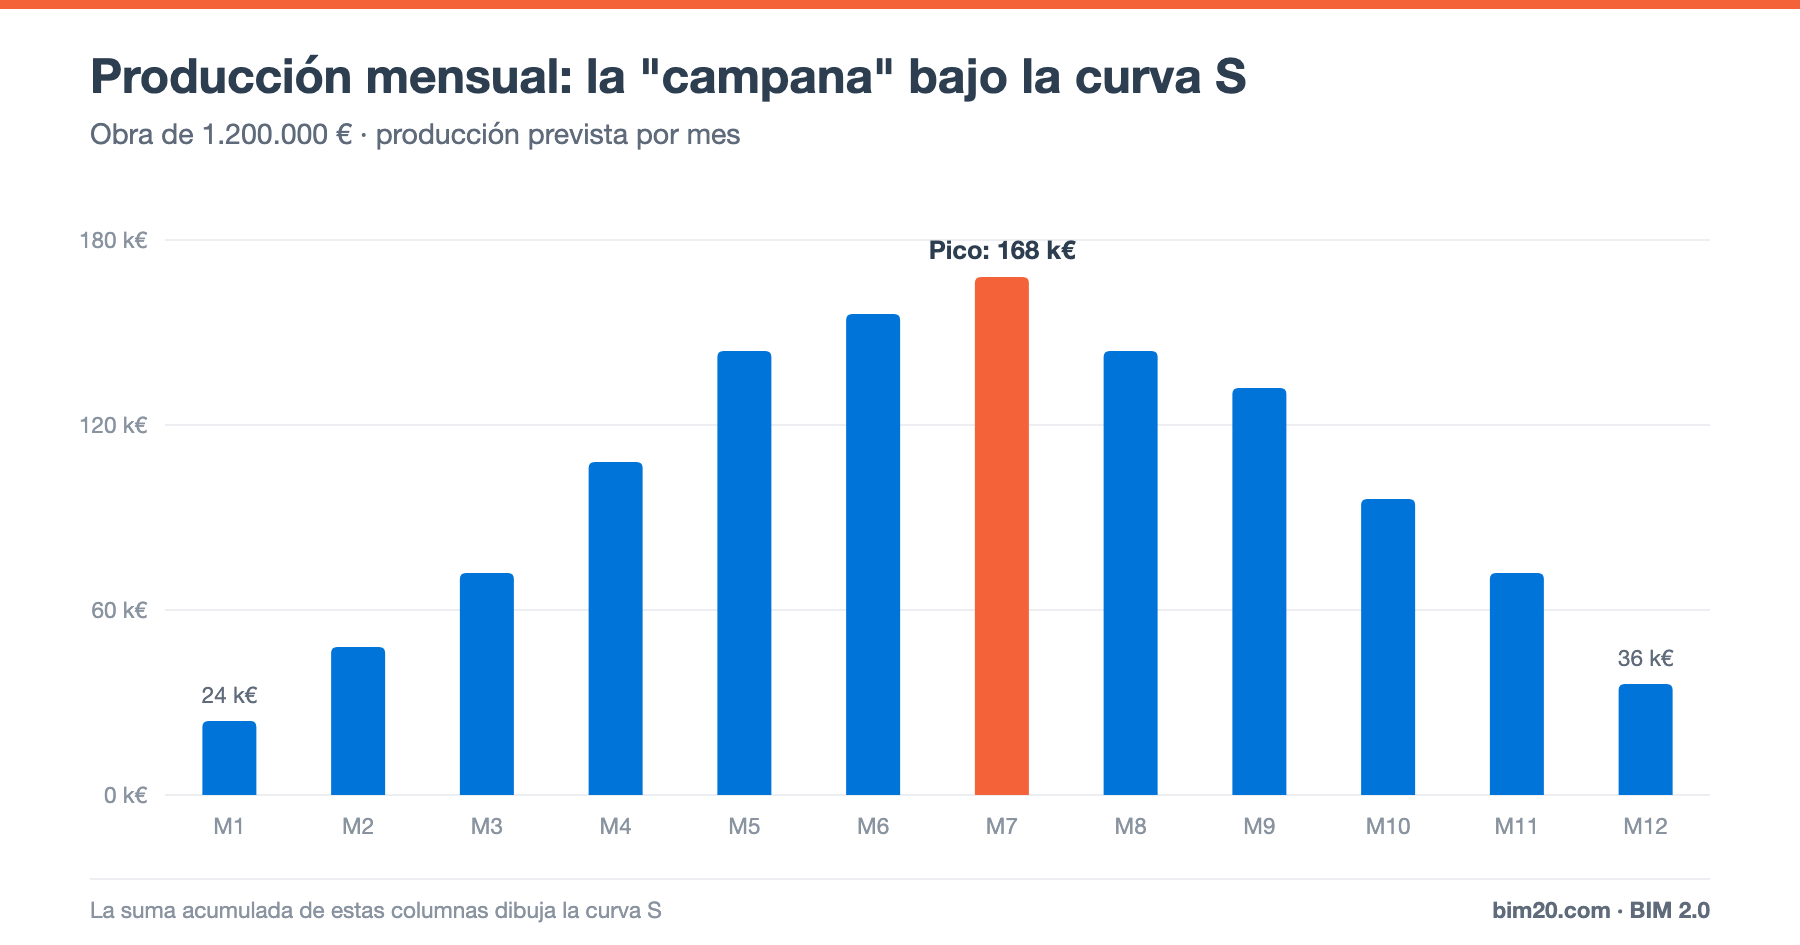
If we plot monthly output, we get a bell shape. If we plot cumulative output, the month-by-month sum of that bell, we get the S.
How to calculate the S-curve step by step
1. Start from the budget and the schedule
You need the budget by line item and the project schedule with its activities linked to those line items.
2. Spread each activity's amount over time
For each activity, distribute its amount across the months in which it is carried out. The simplest approach is a linear spread (if a €30,000 activity lasts 3 months, €10,000 per month), although more realistic profiles can be used.
3. Add up by month
Add up the amount of all activities in each month. This gives you the planned monthly output.
4. Accumulate
Add the output month by month. Expressed as a percentage of the total, this is the planned S-curve or baseline.
Example
On a €1,200,000 project lasting 12 months, planned monthly output (as a % of the total) is:
2 · 4 · 6 · 9 · 12 · 13 · 14 · 12 · 11 · 8 · 6 · 3
Cumulatively this gives: 2%, 6%, 12%, 21%, 33%, 46%, 60%, 72%, 83%, 91%, 97% and 100%. The month of peak output is month 7 (14%), at €168,000.
Planned vs actual S-curve
The S-curve proves its worth when compared with actual progress. In the example, by month 7, 60% of the project should be done, but only 51% has been completed.
That 9-point gap equals €108,000 of output that should have been completed and has not. It may be due to:
- Delays in critical-path activities.
- Lack of resources or subcontractors.
- Design changes awaiting approval.
- Supply problems.
To know whether the delay affects the completion date, you need to review the critical path, because not every output shortfall means a schedule delay.
What the S-curve is used for
Schedule control
It is the most visual way to show management and the client whether the project is ahead or behind.
Billing and cash forecasting
The planned output curve is the basis for forecasting progress certifications and, therefore, collections. Combined with collection and payment terms, it lets you calculate the project cash flow.
Basis of earned value
The planned S-curve in euros is exactly the planned value (PV) in earned value analysis. If you also plot earned value (EV) and actual cost (AC), you get the full picture of cost and schedule.
Resource planning
The output bell shows when more crews, more subcontractors and more financing will be needed.
S-curve variants
- Early and late date S-curve: if calculated using the earliest and latest start dates of each activity, you get a "band" within which actual progress is acceptable.
- Cost S-curve: instead of output (sales), it accumulates planned cost.
- Labor hours S-curve: accumulates labor hours, useful for controlling productivity.
Common mistakes
- Building the curve without linking activities and line items: the curve does not reflect the real budget.
- Not saving the baseline and redrawing the planned curve every month: variances never show up.
- Measuring actual progress "by eye" instead of with measurements (see how to monitor a project).
- Confusing output progress with schedule progress.
Frequently asked questions
Is the S-curve always S-shaped?
Almost always, but its shape varies: projects with a lot of weight at the start (for example, large earthworks) have a curve that is steeper at the beginning.
What is the difference between an S-curve and a Gantt chart?
The Gantt chart shows when each activity is carried out; the S-curve summarizes the cumulative progress of the whole project in a single line.
Conclusion
The S-curve turns the schedule and the budget into a single line that everyone understands. Compared with actual progress, it is a project's first warning indicator, and the basis of earned value and cash forecasting.
👉 With BIM 2.0 for Odoo, the budget, scheduling (integrated with Microsoft Project) and certifications share data, so actual progress comes from the measurements themselves. Request a demo.