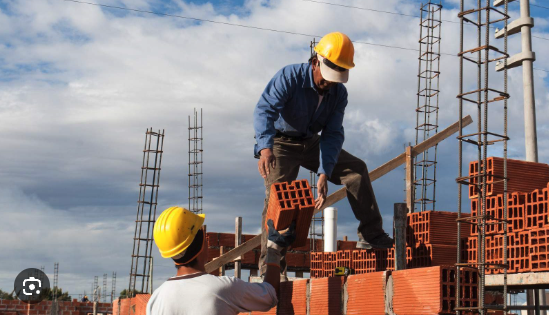
Construction monitoring is the process of periodically checking whether a project is progressing as planned in terms of schedule, cost and quality. Good monitoring lets you detect problems while they can still be corrected and report the real status of the project to management and the client.
In this guide we explain how to organize project monitoring step by step.
The three axes of construction monitoring
- Physical progress: how much work has been executed.
- Schedule: whether progress is in line with the plan.
- Cost: whether what has been spent matches what has been executed.
Looking at only one of them leads to wrong conclusions. A project can be "on schedule" while spending twice as much, or "on budget" simply because it has not progressed.
Step 1: Establish a baseline
You cannot monitor without a reference. Before the project starts you need:
- A cost budget by line item. See how to make a construction budget.
- A schedule with activities, durations and dependencies. See how to make a construction schedule with a Gantt chart.
- A link between activities and line items, so physical progress can be translated into financial progress.
Save this version as the baseline: it will be the reference against which you compare everything.
Step 2: Record day-to-day work with daily reports
The daily report is the source of information for monitoring. It should capture:
- Personnel on site (own and subcontracted) and hours.
- Work carried out and line items affected.
- Equipment used.
- Materials received.
- Incidents, weather conditions and visits.
- Photographs.
With BIM 2.0, recording of site attendance, work reports, material receipts and equipment rental is done from the ERP itself, including from a mobile phone, and each record is charged to the project.
Step 3: Measure physical progress
There are several ways to measure progress:
- By quantities: quantity executed for each line item (m³, m², units). This is the most accurate method and the one used for certification.
- By milestones: a percentage assigned to specific milestones (setting out 10%, structure 40%…).
- By the manager's estimate: a subjective percentage per activity. Quick, but not very reliable.
- From the BIM model: marking executed elements in the model, building on the element-to-line-item link explained in BIM 5D cost estimating.
Recommendation: measure the highest-value line items by quantities executed and the rest by milestones.
Step 4: Compare with the schedule
Update the schedule with actual progress and compare it with the baseline:
- Which activities are behind?
- Is any of them on the critical path? If so, it delays the project finish.
- How much float is left on the others?
The S-curve (cumulative planned versus actual progress) is the most visual way to communicate schedule status.
Step 5: Compare with cost
For each line item or section, compare the actual cost with the planned cost for the quantity executed. This tells you whether the project is making or losing money at any given moment.
The most complete method is earned value (CPI, SPI, EAC), which we explain in detail in how to control project costs.
Step 6: Progress meetings
Set up a routine:
- Daily (on site): coordination of work fronts between the foreman and subcontractors.
- Weekly: the site manager and the technical office review progress, short-term planning, purchasing and subcontracting.
- Monthly: financial close with management: output, cost, margin and forecast at completion.
Some companies apply techniques such as Last Planner for collaborative weekly planning with subcontractors.
Step 7: The construction progress report
A good monthly report includes, at a minimum:
- Executive summary (overall status as a traffic light).
- Planned vs. actual physical progress (S-curve).
- Milestones achieved and upcoming.
- Financial situation: output, cost, margin, variances.
- Certification for the period and amounts pending collection.
- Relevant subcontractors and purchases.
- Quality, safety and environment.
- Risks, incidents and corrective actions.
- Photo report.
Key indicators (KPIs) for construction monitoring
- % of physical progress, actual vs. planned.
- SPI (schedule index) and CPI (cost index).
- Actual margin vs. planned.
- Monthly certified output.
- Cumulative days of delay on the critical path.
- Open incidents and average resolution time.
- Labor hours per unit of output.
Tools for construction monitoring
- Spreadsheets: useful at the beginning, but hard to keep up to date.
- Planning tools (MS Project, Primavera P6) for the schedule.
- Field apps for incidents and documentation.
- Construction ERP to unite progress, cost and schedule in a single dataset.
We review the options in the 10 best construction management software. BIM 2.0 also integrates with Microsoft Project, so that the schedule and financial monitoring share data.
Frequently asked questions
Who monitors a construction project?
The site manager leads operational monitoring, supported by the technical office for quantities, scheduling and costs. The project supervision team (dirección facultativa: the architect and quantity surveyor appointed by the developer) carries out its own monitoring on the developer's behalf.
What is the difference between monitoring and control?
Monitoring measures and compares; control adds decision-making and corrective action. They are two parts of the same cycle.
How often should the schedule be updated?
It is advisable to update it at least weekly with actual progress and to revise the baseline only when there are approved changes.
Conclusion
Good construction monitoring requires a clear baseline, reliable daily records, progress measurement and systematic comparison with schedule and cost. If that information lives in a single system, monitoring stops being an administrative effort and becomes a management tool.
👉 See how it works in the BIM 2.0 demo.