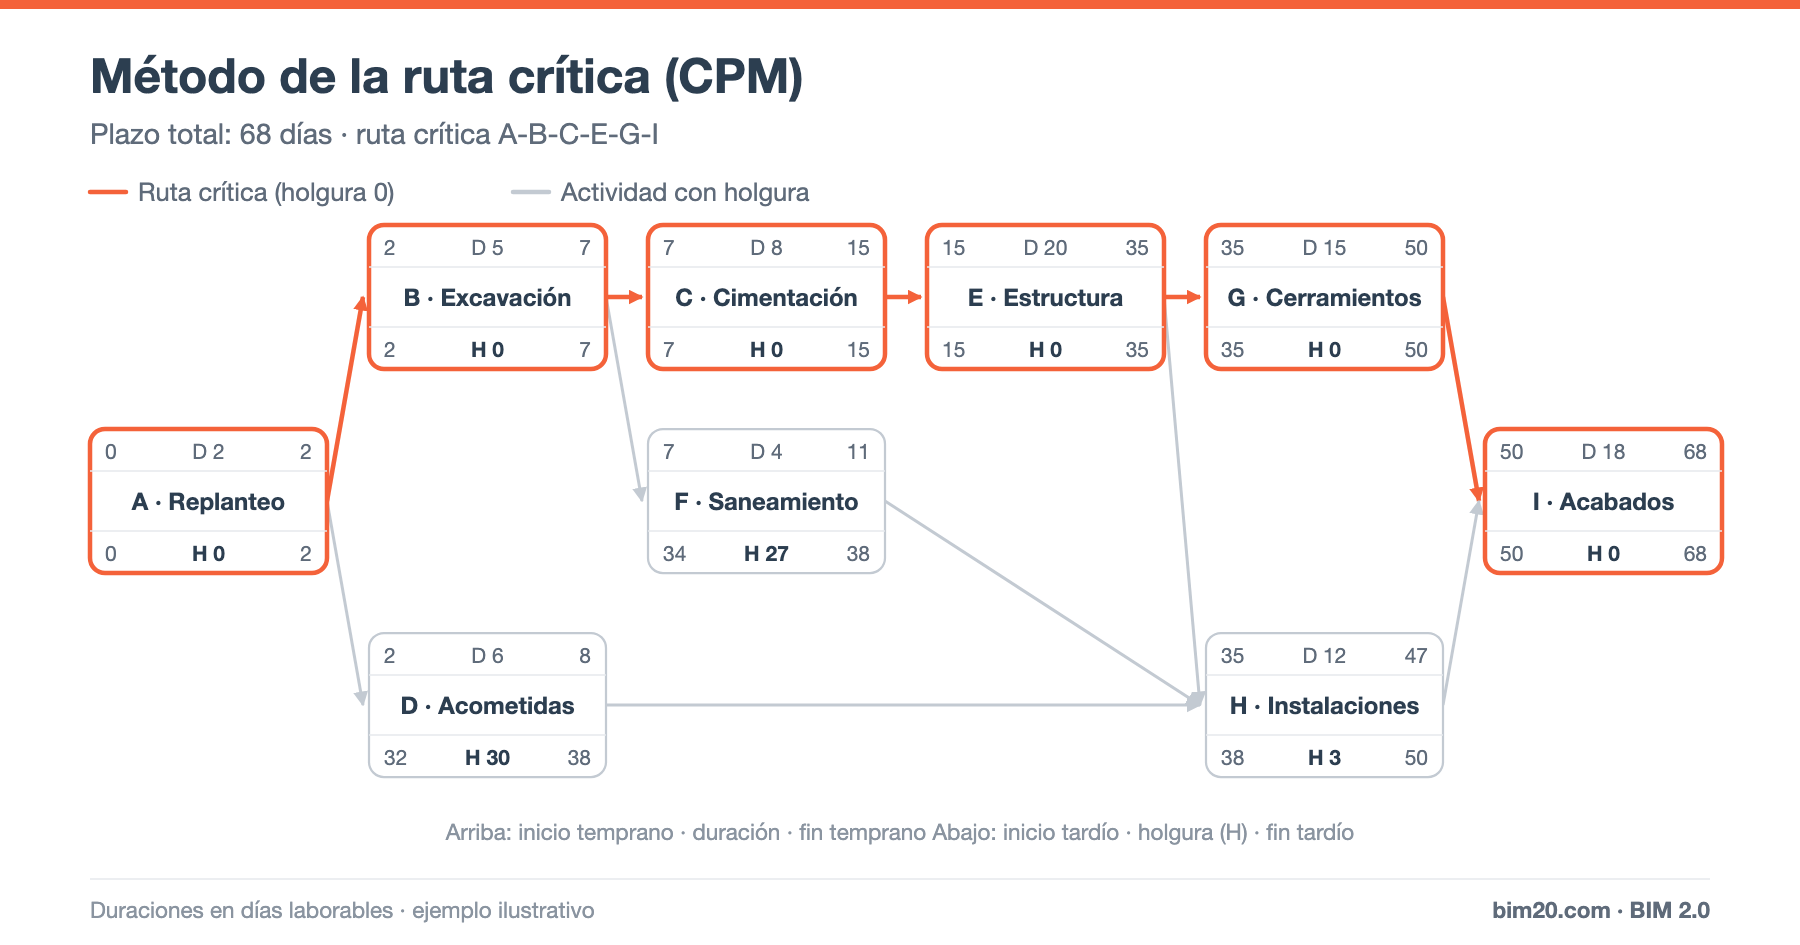
The critical path method (CPM) lets you calculate the minimum duration of a project and identify which activities cannot be delayed without delaying the finish. It is the mathematical basis of any schedule with a Gantt chart, even when the software calculates it automatically.
Understanding how it works helps you read a schedule better and make better decisions when delays occur.
Basic concepts
- Activity: work with a duration (D).
- Precedence: a relationship stating which activities must finish before another can start.
- Early start (ES) and early finish (EF): the earliest an activity can start and finish.
- Late start (LS) and late finish (LF): the latest it can start and finish without delaying the project.
- Total float (TF): how long an activity can be delayed without delaying the project = LS − ES.
- Free float (FF): how long it can be delayed without delaying the early start of any successor.
- Critical path: the chain of activities with zero total float.
The example: 9 activities
- A · Setting out: 2 days.
- B · Excavation: 5 days; after A.
- C · Foundations: 8 days; after B.
- D · Utility connections: 6 days; after A.
- E · Structure: 20 days; after C.
- F · Drainage: 4 days; after B.
- G · Envelope: 15 days; after E.
- H · Services (MEP): 12 days; after E, D and F.
- I · Finishes: 18 days; after G and H.
Step 1: forward pass (early dates)
For each activity: ES = largest EF of its predecessors and EF = ES + D.
- A: ES 0 → EF 2
- B: ES 2 → EF 7
- D: ES 2 → EF 8
- C: ES 7 → EF 15
- F: ES 7 → EF 11
- E: ES 15 → EF 35
- G: ES 35 → EF 50
- H: ES = max(35, 8, 11) = 35 → EF 47
- I: ES = max(50, 47) = 50 → EF 68
Minimum project duration: 68 days.
Step 2: backward pass (late dates)
Starting from the end: LF = smallest LS of its successors and LS = LF − D.
- I: LF 68 → LS 50
- G: LF 50 → LS 35
- H: LF 50 → LS 38
- E: LF = min(35, 38) = 35 → LS 15
- C: LF 15 → LS 7
- F: LF 38 → LS 34
- D: LF 38 → LS 32
- B: LF = min(7, 34) = 7 → LS 2
- A: LF = min(2, 32) = 2 → LS 0
Step 3: float
Total float (LS − ES):
- A, B, C, E, G, I: 0 → critical.
- H · Services: 38 − 35 = 3 days.
- F · Drainage: 34 − 7 = 27 days.
- D · Utility connections: 32 − 2 = 30 days.
Critical path: A → B → C → E → G → I (2 + 5 + 8 + 20 + 15 + 18 = 68 days).
Free float (smallest ES of the successors − own EF):
- D: 35 − 8 = 27 days (versus 30 of total float).
- F: 35 − 11 = 24 days (versus 27).
- H: 50 − 47 = 3 days.
The difference matters: if D is delayed 28 days, it does not delay the project, but it does delay the early start of the services (H would start on day 36 instead of 35), consuming part of its float.
How to use the critical path on site
- Focus your monitoring on critical activities: a one-day delay in the structure is a one-day delay in delivery.
- Use float to level resources: the utility connections can be shifted so they do not coincide with other work using the same crew.
- To shorten the project, act on the critical path (more resources, overlaps, changes of method). Shortening non-critical activities does not bring the finish forward. Keep in mind that when you shorten the critical path, another chain may become critical.
- Recalculate the critical path with every update: an activity with little float (like H, with 3 days) can quickly become critical.
Dependencies with lags
On real projects, start-to-start and finish-to-finish relationships and lags are also used (for example, starting the rendering 5 days after the partition walls start). The calculation is the same, adding or subtracting the lags.
CPM, cost and earned value
The CPM schedule is the basis of the S-curve and of the planned value in earned value analysis. An SPI below 1 indicates a production delay, but only the critical path tells you whether that delay affects the finish date.
Frequently asked questions
Can there be several critical paths?
Yes, if several chains of activities have zero float. It is a higher-risk situation.
What is the difference between CPM and PERT?
CPM uses fixed durations; PERT uses three estimates (optimistic, most likely and pessimistic) to account for uncertainty.
Conclusion
The critical path method explains why a project lasts as long as it does and where the risk of delay lies. Knowing how to calculate dates and float lets you read any schedule with good judgment and act where it really matters.
👉 BIM 2.0 for Odoo integrates with Microsoft Project to connect the schedule with the budget and progress. Request a demo.