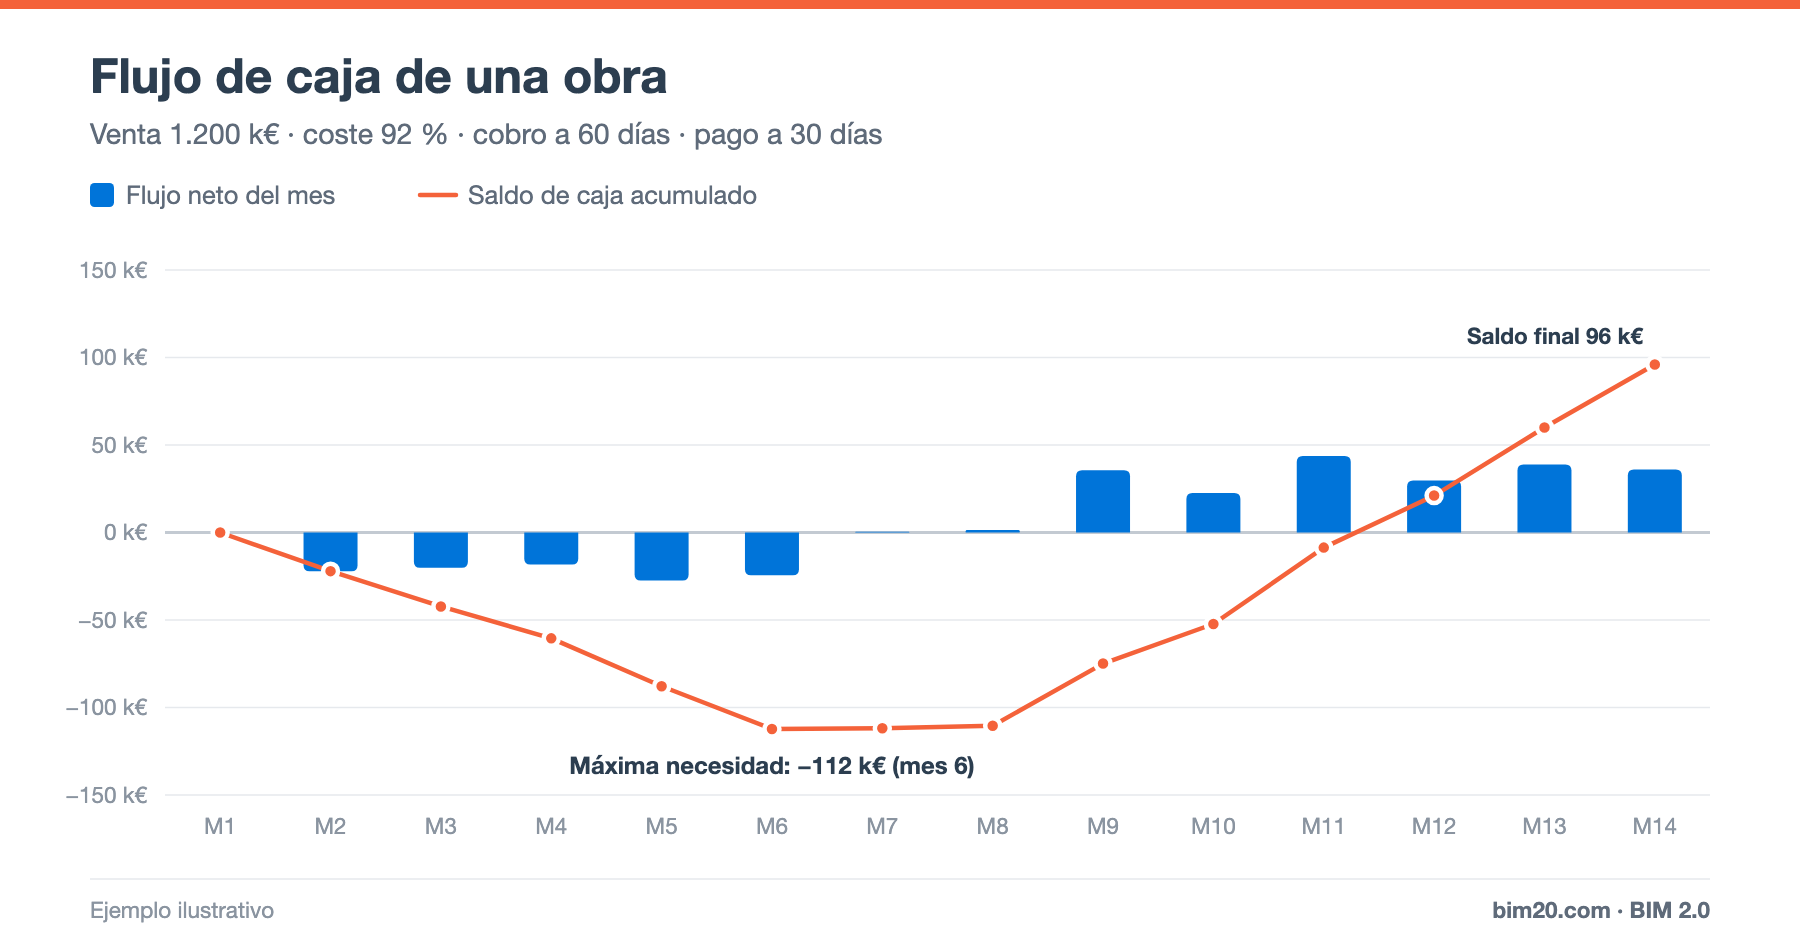
A project can be profitable and still put the contractor in difficulty. The reason is cash flow: a good part of the costs is paid before the work is collected, and that difference has to be financed. Often, a contractor's problems do not come from a lack of margin but from a lack of cash.
In this article we explain how to calculate a project's cash flow, how to read it and how to reduce the financing need.
What is project cash flow
It is the difference, month by month, between the money coming in (client payments) and the money going out (payments to suppliers, subcontractors, staff and equipment):
Net cash flow for the month = receipts for the month − payments for the month
Cumulative balance = sum of the net cash flows up to that month
The lowest point of the cumulative balance is the project's peak financing need.
Data you need
- Planned monthly production (the bell of the S-curve).
- Planned monthly cost, from the cost budget.
- Collection period: from the moment the work is executed until it is paid (certification + approval + payment term).
- Payment terms to suppliers, subcontractors and staff.
- Advances, retentions and guarantees.
Month-by-month example
A project with €1,200,000 in sales over 12 months, with:
- A project cost of 92% of sales (8% gross margin, that is, €96,000).
- 60-day collection: work executed in month 1 is collected in month 3.
- 30-day payment: month 1 costs are paid in month 2.
- Monthly production shaped like a bell, as in the S-curve.
Figures in thousands of euros (k€):
| Month | Production | Receipts | Payments | Net cash flow | Cumulative balance | |---|---|---|---|---|---| | 1 | 40 | 0 | 0 | 0.0 | 0.0 | | 2 | 70 | 0 | 36.8 | −36.8 | −36.8 | | 3 | 100 | 40 | 64.4 | −24.4 | −61.2 | | 4 | 120 | 70 | 92.0 | −22.0 | −83.2 | | 5 | 140 | 100 | 110.4 | −10.4 | −93.6 | | 6 | 150 | 120 | 128.8 | −8.8 | −102.4 | | 7 | 150 | 140 | 138.0 | +2.0 | −100.4 | | 8 | 140 | 150 | 138.0 | +12.0 | −88.4 | | 9 | 110 | 150 | 128.8 | +21.2 | −67.2 | | 10 | 80 | 140 | 101.2 | +38.8 | −28.4 | | 11 | 60 | 110 | 73.6 | +36.4 | +8.0 | | 12 | 40 | 80 | 55.2 | +24.8 | +32.8 | | 13 | – | 60 | 36.8 | +23.2 | +56.0 | | 14 | – | 40 | 0 | +40.0 | +96.0 |
How to read the table:
- From month 2 to month 6, payments exceed receipts and net cash flow is negative every month.
- Month 6: cumulative balance of −€102.4k, the peak financing need.
- From month 7, receipts from the peak production phase exceed payments and the balance recovers.
- Month 11: the cumulative balance turns positive again.
- Month 14: once everything has been collected and paid, the final balance is +€96k, exactly the project's margin.
The conclusion is clear: to earn €96,000, the company has to advance up to about €102,000 for several months.
The financial cost of the gap
That money has a cost: interest on credit lines or the opportunity cost of the company's own cash. At 6% per year, financing about €100,000 for half a year costs in the order of €3,000, close to 3% of the project's margin. With longer collection periods or thinner margins, the impact is much greater.
That is why the financial cost must be considered when estimating, within the overheads.
How to reduce the financing need
On the receipts side
- Certify on time and without errors: every day of delay in certification is one more day of financing. See progress certification.
- Negotiate an advance and payment milestones aligned with the cost curve.
- Reduce work performed but not yet certified. See unbilled work.
- Claim additional work early.
- Factoring of certifications, weighing its cost.
On the payments side
- Align payment terms to subcontractors with collection terms (always within the applicable late-payment regulations).
- Avoid stockpiling materials too early.
- Guarantee retentions from subcontractors, agreed in the contract.
On the scheduling side
- Avoid delays: lengthening the project lengthens indirect costs without increasing sales.
- Schedule the largest purchases according to the production curve.
Company cash flow
A contractor's cash flow is the sum of the cash flows of all its projects plus overhead expenses. A growing company, with many projects starting at the same time, accumulates the negative-flow phases of all of them: this is the moment of greatest cash strain.
Related indicators
- Peak financing need per project and in total.
- Average collection period and average payment period.
- Month in which the balance turns positive.
You will find more indicators in the most widely used KPIs in construction.
Frequently asked questions
Are cash flow and margin the same thing?
No. Margin measures whether the project makes money; cash flow measures when that money comes in and goes out. A project with a good margin can have a very high financing need.
How often should the cash forecast be updated?
Monthly, with actual production, certifications issued and committed payments.
Conclusion
A project's cash flow reveals the money that has to be advanced to earn the margin. Calculating it before signing the contract and monitoring it every month is as important as controlling costs.
👉 With BIM 2.0 for Odoo, certifications, supplier invoices and payment statements are in the same system as accounting and treasury. Request a demo.