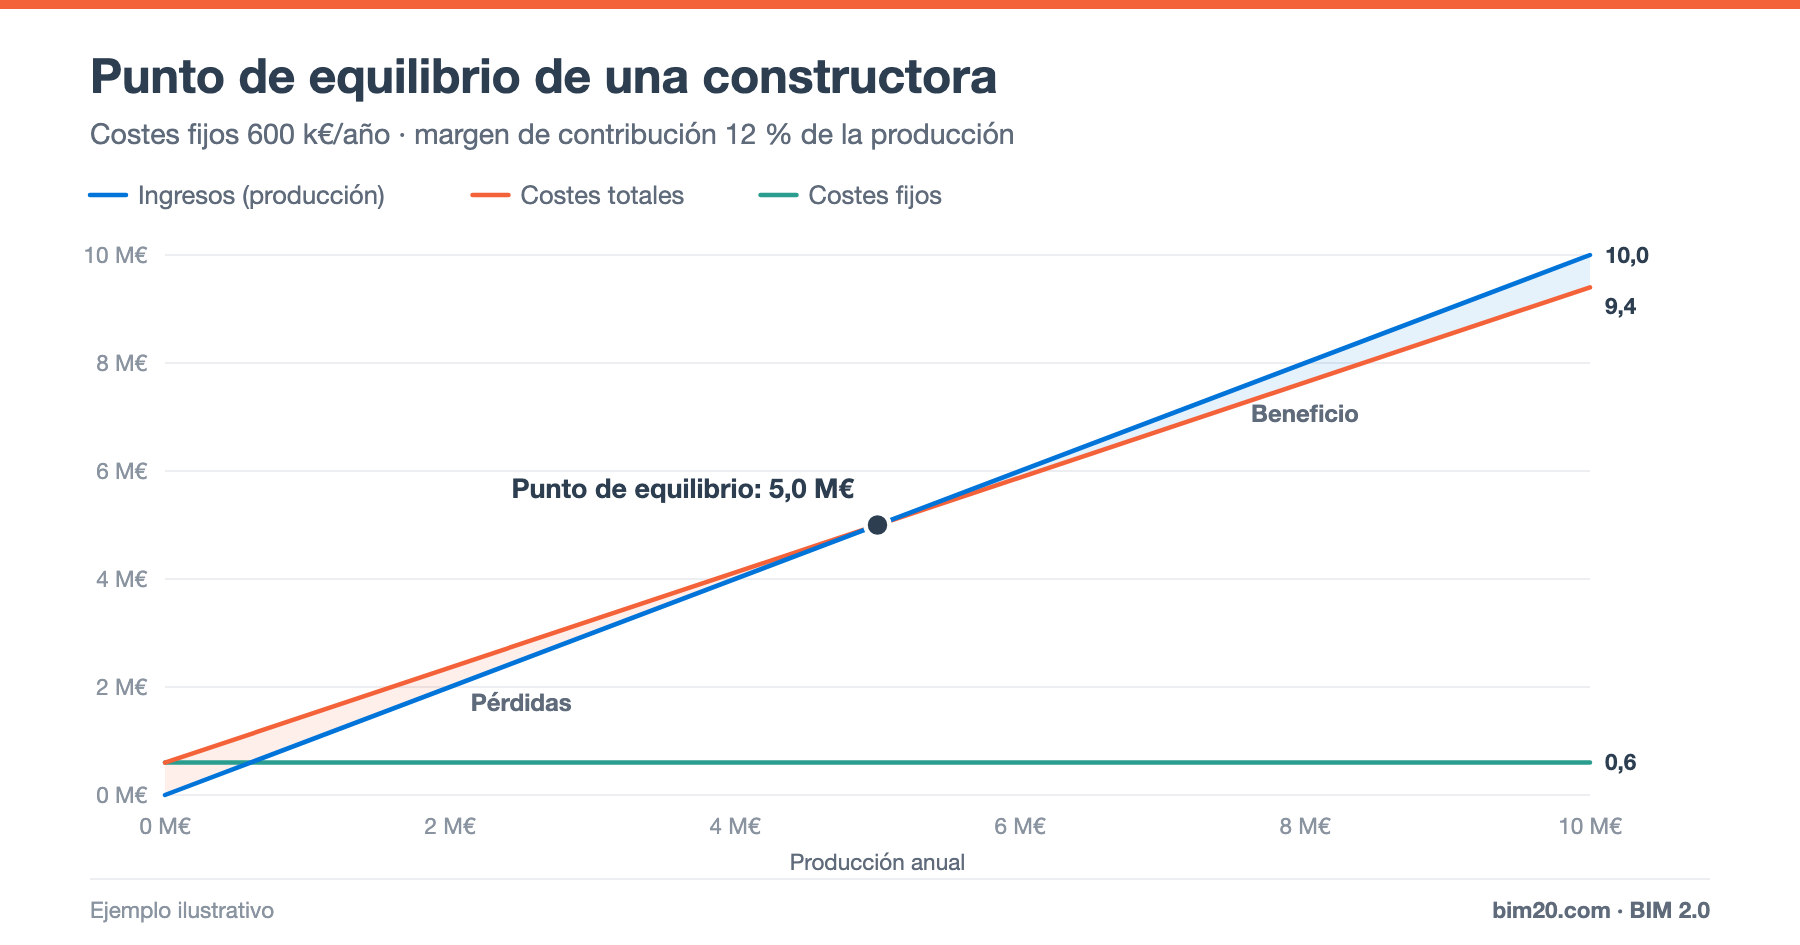
The break-even point is the output volume above which a company starts making money. Below it, output does not cover fixed costs and there are losses; above it, each additional euro of output contributes to profit.
For a contractor it is a key figure: it tells you how much work you must execute each year to sustain the company's overhead structure.
Fixed and variable costs in construction
Fixed costs (overhead structure)
They do not depend on the volume of work in the short term:
- Head office staff: management, administration, technical office, purchasing, sales.
- Rent, utilities and IT systems.
- General insurance, consulting fees, fixed financial costs.
- Depreciation of equipment not charged to projects.
Variable costs
They grow with output. In a contractor they are, in practice, the project costs: materials, subcontractors, site labor, equipment and the indirect costs of each project.
Contribution margin
Contribution margin = output − variable costs
Contribution ratio (%) = contribution margin / output
It is the part of each euro produced that remains to cover fixed costs and generate profit. In construction it roughly matches the gross project margin.
Break-even formula
Break-even point (output) = fixed costs / contribution ratio
Example
A contractor with:
- Fixed overhead costs: €600,000 per year.
- Average contribution margin of its projects: 12% of output.
Break-even point = 600,000 / 0.12 = €5,000,000
The company needs to produce €5M a year to avoid losing money.
On a break-even chart:
- The revenue line grows with output.
- The total cost line starts at €0.6M (fixed costs) and grows by 88% of each euro produced.
- They cross at €5.0M: the break-even point.
What if the company produces €6.5M?
- Contribution margin = 6.5 × 12% = €780,000
- Profit (before taxes and other non-operating items) = 780,000 − 600,000 = €180,000
- Margin of safety = (6.5 − 5.0) / 6.5 = 23%: output could fall by 23% before the company enters a loss.
What if the project margin drops to 10%?
Break-even point = 600,000 / 0.10 = €6,000,000. Two percentage points less margin require producing €1M more per year just to avoid losing money. This is why cost control on each project is so decisive for the company.
What the break-even point is for
- Sales planning: how much work must be contracted each year.
- Pricing policy: what minimum margin to accept in bids.
- Sizing the structure: if the backlog falls, do fixed costs need adjusting?
- Overheads in bids: the overhead percentage applied in estimates must be consistent with the real structure. See overheads and contractor's profit.
Limitations of the model
- It assumes the contribution margin is constant, when in reality it varies widely between projects.
- Fixed costs are not fixed forever: if output doubles, the structure will grow too.
- It ignores cash: a company above its break-even point can still have cash problems. See project cash flow.
That is why it is worth recalculating it every year and using it together with the actual margin of projects.
Frequently asked questions
Are project indirect costs fixed or variable?
For the company they are usually treated as variable (they exist only if there is work), even though within each project they behave as fixed over time. See direct and indirect costs.
What is a good margin of safety?
The higher, the better. A low margin of safety means a small drop in output would push the company into losses.
Conclusion
The break-even point translates the company's structure into a minimum output figure. Combined with the actual margin of projects, it helps you decide how much work to contract, at what price and with what structure.
👉 BIM 2.0 for Odoo integrates each project's margin with the company's analytic accounting. Request a demo.