NPV (net present value), IRR (internal rate of return) and ROI (return on investment) are the most widely used indicators for deciding whether an investment is worthwhile. In construction and real estate they are applied to property developments, land purchases, equipment investments and concession projects.
In this article we explain what each one measures, how it is calculated and how to interpret it using a development example.
The example: a four-year development
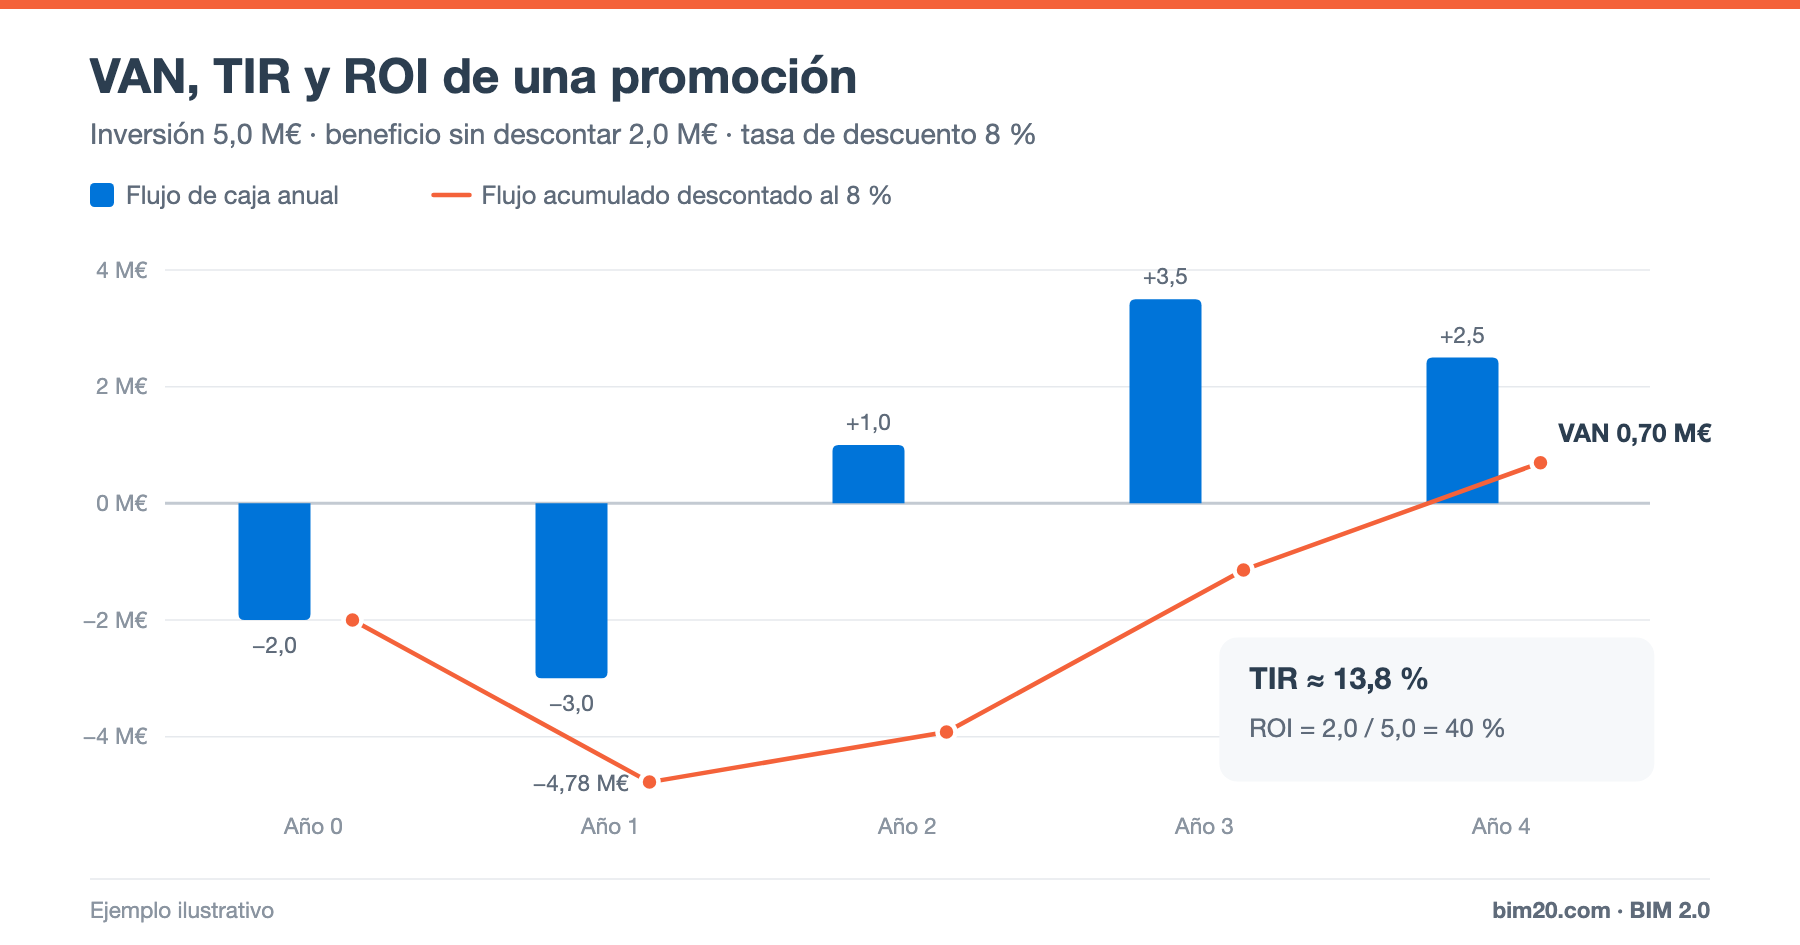
Annual cash flows of an illustrative development (in millions of euros):
- Year 0: −2.0 (land purchase)
- Year 1: −3.0 (construction)
- Year 2: +1.0 (first handovers)
- Year 3: +3.5
- Year 4: +2.5
Total investment: €5.0M. Sum of cash flows: +€2.0M of profit before discounting.
ROI: return on investment
ROI = profit / investment
ROI = 2.0 / 5.0 = 40%
It is easy to understand, but it has a major limitation: it ignores time. 40% over four years is not the same as 40% over two.
NPV: net present value
NPV adds up all cash flows discounted to the present using a rate (i) that reflects the cost of capital and risk:
NPV = Σ Fₜ / (1 + i)ᵗ
With a rate of 8%:
- Year 0: −2.0 / 1.00 = −2.000
- Year 1: −3.0 / 1.08 = −2.778
- Year 2: +1.0 / 1.1664 = +0.857
- Year 3: +3.5 / 1.2597 = +2.778
- Year 4: +2.5 / 1.3605 = +1.838
NPV = +€0.70M
Interpretation:
- NPV > 0: the investment returns more than the required rate (8%) and creates value: in today's euros, €0.70M above that minimum return.
- NPV = 0: it returns exactly the required rate.
- NPV < 0: it destroys value compared with the alternative.
IRR: internal rate of return
The IRR is the discount rate that makes NPV equal to zero. It is the investment's implicit annual return.
In the example, the IRR ≈ 13.8%. Since it is higher than the required rate of 8%, the development is attractive.
IRR is calculated by trial and error or with Excel's IRR function.
Limitations of IRR
- If cash flows change sign several times (for example, a large replacement investment halfway through the project), there may be several IRRs.
- It does not show the size of the profit: a small project can have a very high IRR and add little value.
- To compare mutually exclusive projects, NPV prevails.
Payback period
This is the time it takes to recover the investment:
- Simple payback: the undiscounted cumulative flow is −2.0, −5.0, −4.0, −0.5 and +2.0. It is recovered during year 4: ≈ 3.2 years.
- Discounted payback: the discounted cumulative flow is −2.00, −4.78, −3.92, −1.14 and +0.70. It is recovered during year 4: ≈ 3.6 years.
It is an indicator of risk and liquidity: the sooner the investment is recovered, the less exposed the investor is.
How to use them together
- NPV: does it create value? How much?
- IRR: what annual return does it offer?
- ROI: what total profit on the amount invested? (useful for communication, not for deciding on its own).
- Payback: how long am I exposed?
Sensitivity analysis
In development, the most uncertain variables are the sale price, the sales pace, the construction cost and the timeline. Recalculate NPV and IRR under scenarios:
- Construction cost +10%.
- Sales delayed by one year.
- Sale price −5%.
If NPV remains positive under reasonable scenarios, the investment is robust. Since construction cost is one of those critical variables, a reliable construction budget and good cost control protect the expected return.
NPV, IRR and cost-benefit analysis
Cost-benefit analysis uses the same discounting logic, but compares alternatives whose benefits are not always cash flows (savings, social benefits).
Frequently asked questions
What discount rate do I use in a development?
The minimum return the investor requires for the project's risk. It is usually higher the more uncertain the land, the permit or the market is.
Is a high IRR or a high NPV better?
To choose between mutually exclusive projects, NPV. IRR is useful for communicating the return and comparing it with the required rate.
Conclusion
NPV, IRR, ROI and payback look at the same investment from different angles. Used together and with sensitivity analysis, they let you decide with good judgment whether a development or construction project is worthwhile.
👉 With BIM 2.0 for Odoo you can compare budgets and control the actual cost of the project that underpins that return. Request a demo.