Cost-benefit analysis (CBA) is a technique for deciding whether a project is worthwhile and for choosing between alternatives. It compares all costs and all benefits over the life of the project, expressed in today's euros.
In construction it is used both for major investment decisions (refurbish or rebuild, which façade solution to choose) and for analyzing the profitability of each project.
Steps of the cost-benefit analysis
1. Define the objective and the alternatives
For example, for an old office building:
- A: basic refurbishment.
- B: energy refurbishment.
- C: demolition and new build.
Always include the "do nothing" alternative as a reference when it makes sense.
2. Identify costs and benefits
Costs: initial investment, maintenance, energy, replacements, decommissioning, financing.
Benefits: rental or sales income, energy savings, lower maintenance, residual value, occupancy improvements.
3. Place them in time
Build a table with the costs and benefits of each year over the analysis horizon (for example, 20 years).
4. Discount them
One euro ten years from now is worth less than one euro today. That is why cash flows are discounted at a rate:
Present value = cash flow in year t / (1 + i)^t
The discount rate (i) reflects the opportunity cost of capital and risk. In the example we use 5%.
5. Calculate the indicators
- Net NPV = present value of benefits − present value of costs.
- B/C ratio = present value of benefits / present value of costs.
A project is profitable if the net NPV is positive, which is equivalent to B/C > 1.
Example: three alternatives
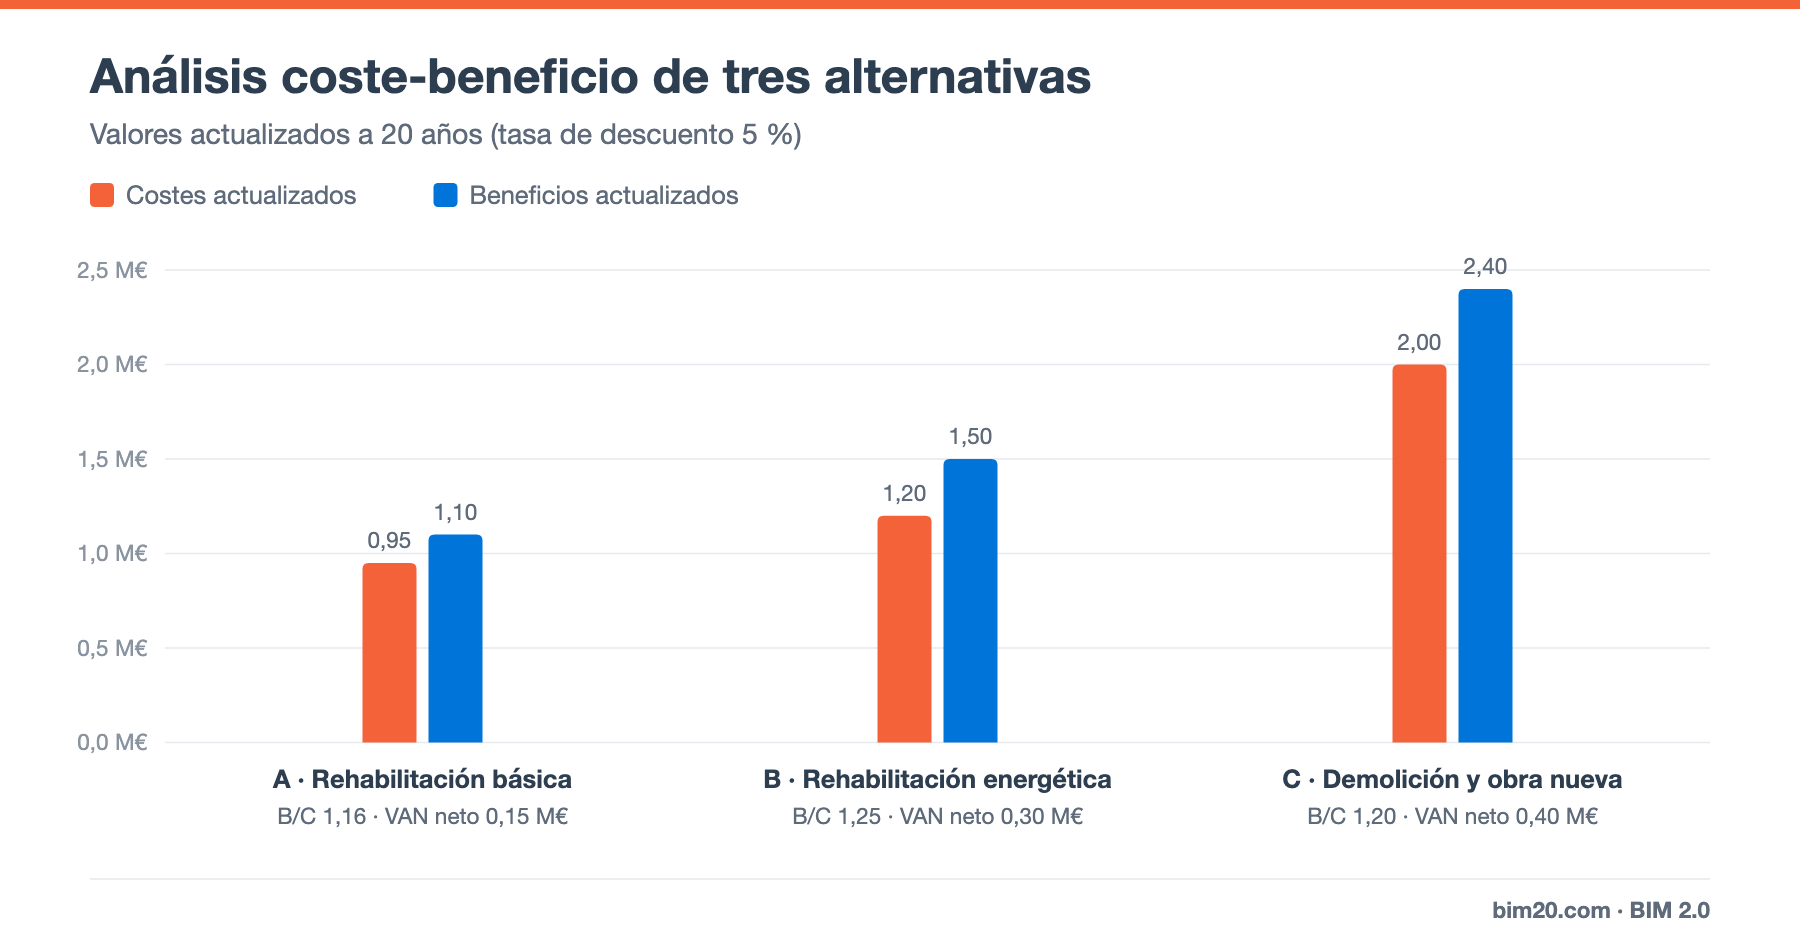
Illustrative example, with values discounted over 20 years at a 5% rate:
- A · Basic refurbishment: costs €0.95M, benefits €1.10M → B/C 1.16 · net NPV €0.15M
- B · Energy refurbishment: costs €1.20M, benefits €1.50M → B/C 1.25 · net NPV €0.30M
- C · Demolition and new build: costs €2.00M, benefits €2.40M → B/C 1.20 · net NPV €0.40M
All three alternatives are profitable, but they do not rank the same way depending on the indicator:
- By B/C ratio, the best is B: every euro invested generates €1.25 of benefit.
- By net NPV, the best is C: it generates more absolute value, although it needs much more investment.
Which one to choose? It depends on the main constraint:
- If capital is limited, prioritize the B/C ratio (B).
- If capital is available and the goal is to maximize value, prioritize NPV (C).
It is also worth comparing the increment: moving from B to C costs €0.80M more and adds €0.90M more in benefits (incremental B/C ≈ 1.13). It is worthwhile if there is no better use for that €0.80M.
Sensitivity analysis
Results depend on assumptions (rental prices, energy cost, discount rate). Repeat the calculation varying the most uncertain ones:
- What if the investment becomes 10% more expensive?
- What if the discount rate rises to 7%?
- What if the energy savings are half of what was forecast?
If an alternative remains the best in all scenarios, the decision is robust.
Cost-benefit at project level
In the day-to-day management of a construction company, "cost/benefit analysis" also means comparing, project by project, what was produced against what was spent: certified sales, actual cost and margin. It is the basis of project margin and cost control.
Differences from other indicators
- NPV and IRR: assess the profitability of an investment's cash flows. See NPV, IRR and ROI.
- CBA: can include quantified non-monetary benefits (time savings, emissions), which is why it is widely used in public works.
- Life-cycle cost: compares only the costs of alternatives that provide the same service.
Common mistakes
- Not discounting cash flows and adding euros from different years.
- Forgetting maintenance and replacement costs.
- Counting the same benefit twice.
- Choosing only by B/C ratio without looking at NPV (or vice versa).
- Not running a sensitivity analysis.
Frequently asked questions
What discount rate should I use?
It depends on the investor and the risk. For private investment the weighted average cost of capital is usually used; for public works, the rate set by the administration.
Is a B/C of 1.05 enough?
Technically it is profitable, but the margin against risk is small. Check the sensitivity before deciding.
Conclusion
Cost-benefit analysis forces you to put all costs and benefits on the table, in today's euros. Used together with NPV, the B/C ratio and sensitivity, it lets you choose the best alternative with solid arguments.
👉 BIM 2.0 for Odoo lets you analyze cost and benefit per project from the ERP's actual data. Request a demo.