CPI and SPI are the two indices of earned value analysis most widely used in project management. They summarize in two numbers whether a project is doing well or badly on cost and on schedule, and they allow projects of very different sizes to be compared.
Formulas
- CPI (Cost Performance Index) = EV / AC
- SPI (Schedule Performance Index) = EV / PV
Where EV is earned value (work performed, valued at planned cost), AC is actual cost and PV is planned value.
How to interpret the CPI
- CPI > 1: the project costs less than planned for the work performed. Example: 1.08 → for every euro spent, work worth €1.08 is produced.
- CPI = 1: the cost budget is being met.
- CPI < 1: there is a cost overrun. A CPI of 0.92 means spending 8.7% more than planned (1 / 0.92 ≈ 1.087).
The cumulative CPI tends to stabilize early: project management experience indicates that, once roughly 20% progress has been passed, it is usually difficult for it to improve significantly. That is why detecting it in time is so valuable.
How to interpret the SPI
- SPI > 1: more has been executed than planned (ahead of schedule).
- SPI = 1: the plan is being met.
- SPI < 1: behind schedule. An SPI of 0.90 means 90% of what should be done has been done.
The limitation of the SPI
At the end of the project, when everything is executed, EV = PV = BAC and the SPI returns to 1 even if the project finished late. That is why, in the final stretch of the project, the SPI loses its warning ability. Alternatives:
- Review the critical path and milestone dates.
- Use Earned Schedule, which expresses delay in time rather than in euros.
In addition, the SPI measures production, not the critical path: you can have SPI = 1 by advancing non-critical activities while the critical one slips.
The four quadrants
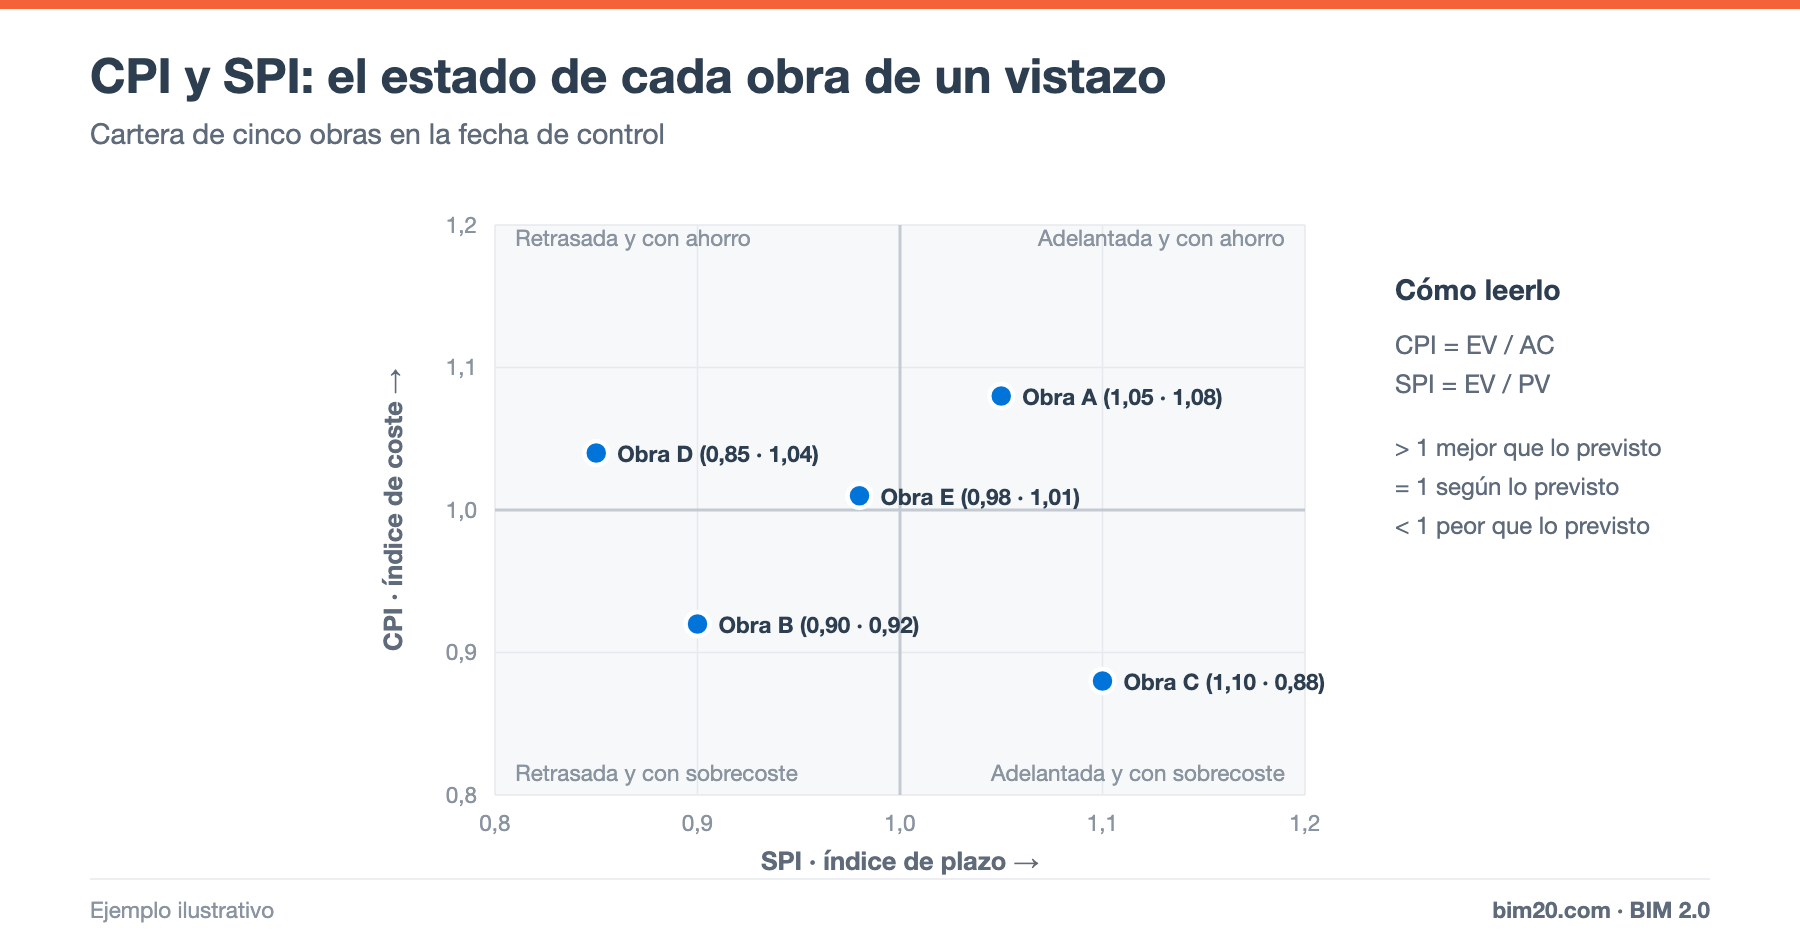
If we plot each project on a chart with the SPI on the horizontal axis and the CPI on the vertical axis, we get four situations:
- CPI ≥ 1 and SPI ≥ 1 – Ahead of schedule and under budget. The ideal situation; make sure quality does not suffer.
- CPI ≥ 1 and SPI < 1 – Behind schedule and under budget. May indicate a lack of resources: little is being spent because little is being produced.
- CPI < 1 and SPI < 1 – Behind schedule and over budget. The most worrying; requires an immediate action plan.
- CPI < 1 and SPI ≥ 1 – Ahead of schedule and over budget. Work is being accelerated with expensive resources (overtime, more crews).
In the example chart in the header (a portfolio of five projects, with SPI · CPI values), Project B (0.90 · 0.92) is management's priority, while Project C (1.10 · 0.88) is ahead of schedule but spending about 14% more than planned (1 / 0.88 ≈ 1.14).
Combined index: CPI × SPI
Some companies use the product CPI × SPI (sometimes called the critical ratio) as an overall indicator. For Project B: 0.92 × 0.90 = 0.83. It is also used to estimate the final cost when assuming that delay will also make the project more expensive; we explain it in EAC, ETC, VAC and TCPI.
Recommended alert thresholds
Each company should set its own thresholds, but a common scheme is:
- ≥ 0.98: under control.
- 0.95 – 0.98: watch; analyze causes.
- < 0.95: alert; action plan with an owner and a date.
Always use the traffic light together with the numerical value, never the color alone.
What to do when the CPI drops
- Identify the line items with the largest variance with a price and consumption analysis.
- Check that AC does not include costs from other projects or advances for material not yet consumed.
- Review labor productivity rates and subcontractors.
- Analyze whether there are changes not yet claimed from the client.
What to do when the SPI drops
- Check whether the delay affects the critical path.
- Check pending supplies and subcontractors.
- Re-plan in the short term with the person in charge of each work front; measure the weekly PPC (Percent Plan Complete).
Frequently asked questions
Are CPI and SPI calculated cumulatively or per period?
Both are useful. The cumulative value shows the overall trend; the period value detects recent changes.
Is a CPI of 1.10 always good?
Not necessarily: it may indicate costs not yet recorded (invoices that have not arrived) or an overly generous cost budget.
Conclusion
CPI and SPI are the fastest way to know how a project is doing and to compare all of the company's projects on a single chart. With clear thresholds and reliable data, they become management's traffic light.
👉 BIM 2.0 calculates the earned value of each project using the actual costs from the ERP. Request a demo.