Where BIM › BI › Configure dashboards
Before you start
BI Administrator profile.
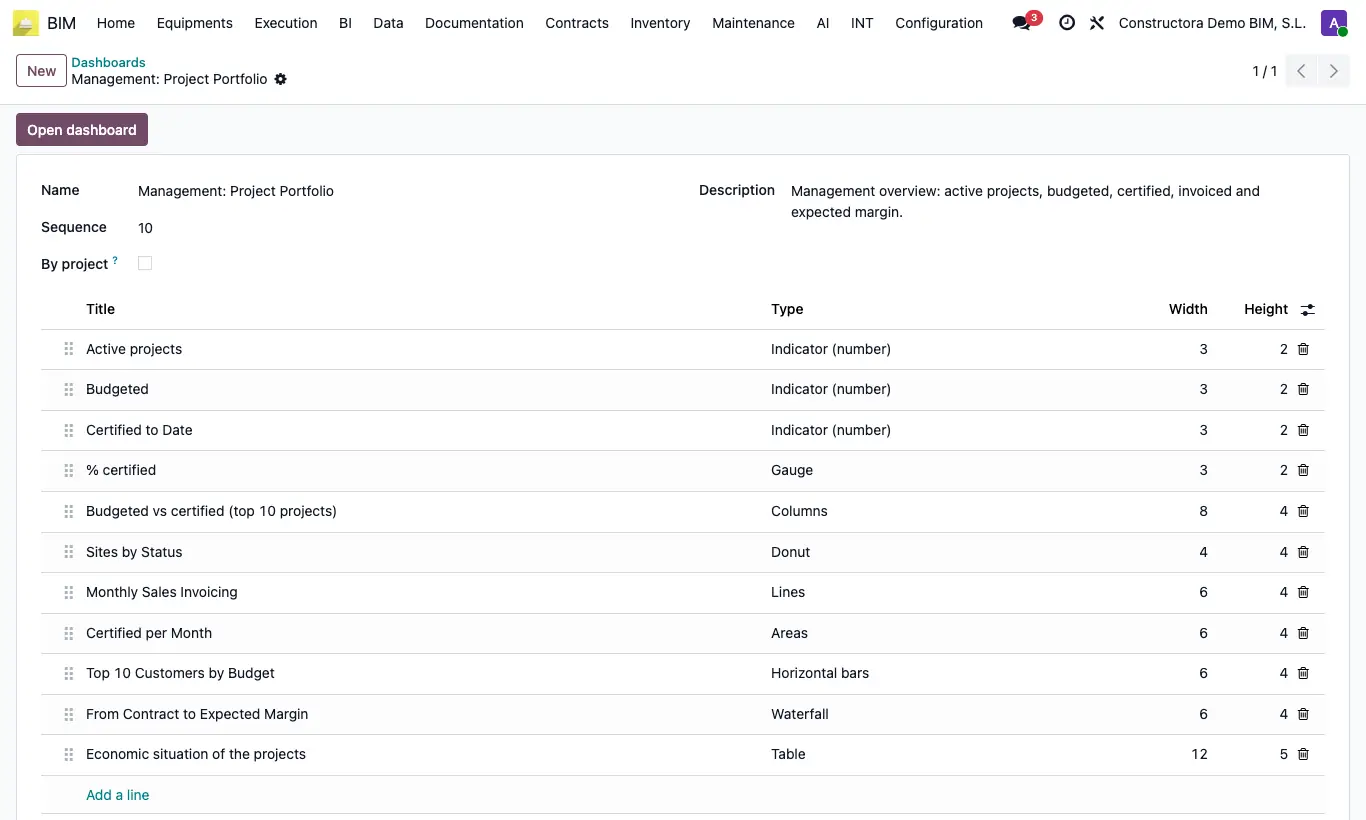
Steps
- Go to BI › Configure dashboards. Drag the rows to change the order in which they appear in Dashboards.
- Click New, enter Name and Description. Tick By project if the dashboard shows a single project, chosen in the dashboard itself.
- In Charts add one line per chart: Title, Type (Indicator (number), Gauge, Columns, Horizontal bars, Lines, Areas, Pie, Donut, Scatter / bubbles, Waterfall or Table), Width (columns out of 12) and Height (rows of 90 px).
- Write the SQL Query: a single SELECT. Put {companies} where the companies go and, in per-project dashboards, {project} where the project goes.
- In Options you can set the format (number, currency or percentage) and a subtitle. Click Test query to see how many rows and columns it returns.
- Save and click Open dashboard.
Warning
If the query contains words such as insert, update, delete or drop, it is rejected with “The query can only read data.”. Each chart reads at most 5000 rows and 20 seconds.
Dashboards read the database directly: they do not respect BIM User see owner documents. Any BI User sees the figures of all projects of the active companies.
Site note
It is easier to design them from the dashboard itself with + Chart or Design with AI: this screen is for tweaking queries or reordering.
Archive a dashboard to hide it without losing its charts.