BIM 2.0Odoo 19

Process manual

Search for what you want to do and follow the steps. Each process shows where it is in the menu, what you need first and which mistakes to avoid.

The life of a project

Dashboards (BI)

How do I add a chart to a dashboard (also with AI)?Indicators, columns, lines, pie, table and more.
Before you start

BI Administrator profile.
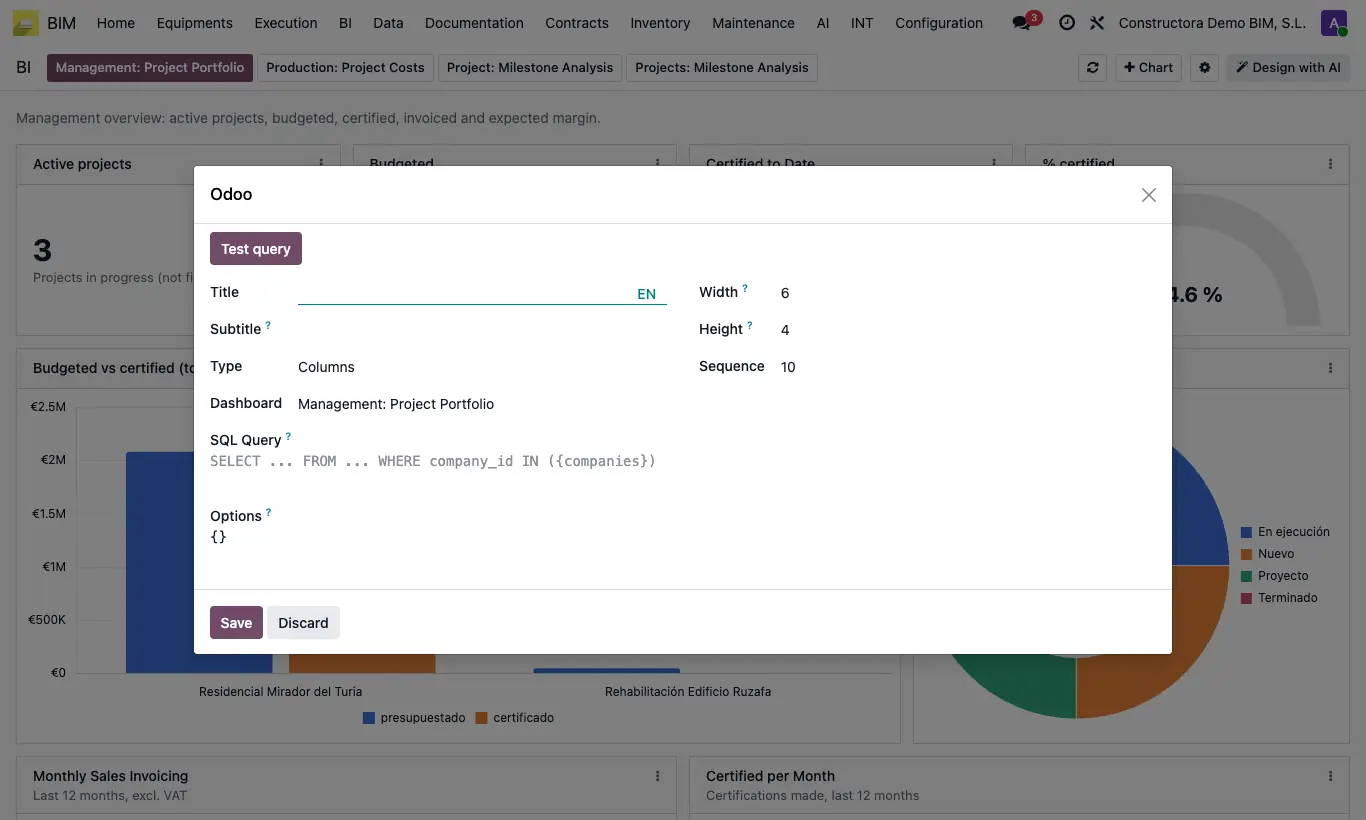
How do I add a chart to a dashboard (also with AI)?

Steps

  1. Open the dashboard and click + Chart.
  2. Choose the element type and configure the query.
  3. Or click Design with AI and describe what you want, for example: “Add a chart with vendor bills of the last 12 months by project”.
  4. Use ⋮ on each chart for its options, and the gear to configure the dashboard.
Site note

Queries are read-only: a dashboard never modifies data. Every AI response can be undone.

Documented version: BIM 2.0 (base_bim_2 19.0.19.04.2026) · Odoo 19