Where BIM › Execution › Programming › Resource Analysis
Budget with stages and scheduled items (with an end date). Daily reports in Done state for the actual value.
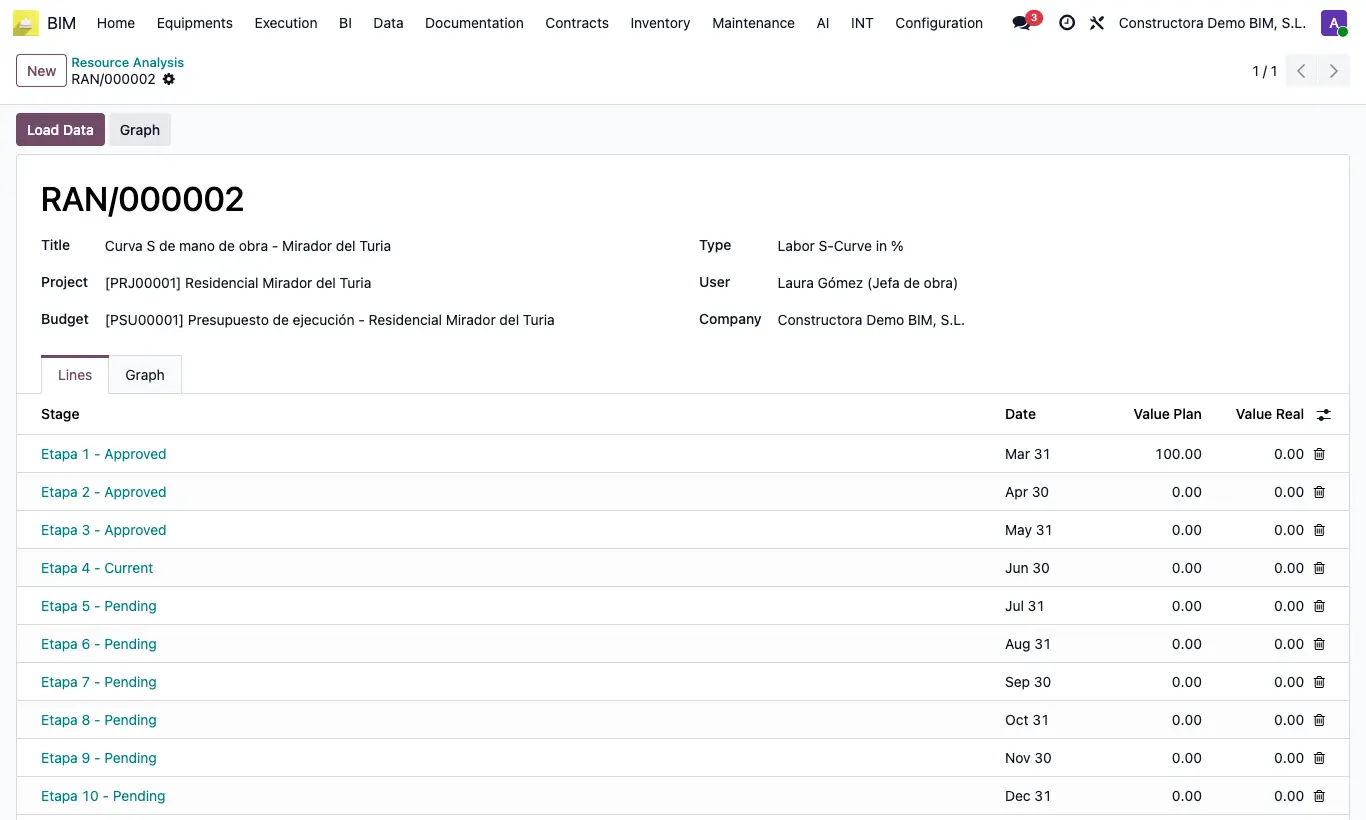
Steps
- Go to Execution › Programming › Resource Analysis and click New.
- Write the Title and choose the Project and the Budget.
- In Type choose Labor S-Curve in % (percentage of the budget's total labor) or Labor S-Curve in Qty (quantities).
- Click Load Data: the Lines tab shows one row per stage with its Date, Value Plan and Value Real.
- Click Graph to draw the two curves in the Graph tab.
With no stages in the budget no line is created, and Graph warns "No data available to generate the chart.".
If the budget has no labor, in Labor S-Curve in % everything comes out as 0.
Use the figures in the Lines tab: the Graph accumulates each curve with the other's values from earlier stages, so its points do not match the table.
If the server does not have Matplotlib, Graph warns "Matplotlib is not installed. Install it to generate charts.".
Value Plan: the labor (resource quantity × item quantity) of the items that end within the stage dates.
Value Real: the sum of the Quantity of the Lines of Advance of the daily reports in Done for that project, dated within the stage and for that budget or with no budget.
Each Load Data deletes the previous lines and recalculates them: repeat it as the work progresses.